
17 October 2022 update: to reflect changes made by DfT after they carried out a Minor roads traffic estimate review
This page provides links to local traffic data from:
- Department for Transport
- GB
- London
- Croydon
- Local main roads
- within LTN
- Speedvisor
- Telraam
- Croydon Street Gazetteer 2021 (with SBS analysis)
- local citizen counts.
You can click on each graph for an enlarged view and follow the links to the source data.
Articles on traffic
- How the traffic came and took over our neighbourhood
- Telraam traffic counters coming to Crystal Palace
- Evaporating traffic
- New TfL data shows significant increase in walking and cycling since the pandemic started
- Active travel in the LTN – July & November 2020
- Satellite Navigation: benefit or bane?
- Traffic surveys
- Tom Chance: Traffic reduction in Crystal Palace and Anerley (May 2014)
- Tom Chance: Crystal Palace traffic – what are the facts and what’s to be done? (November 2020)
Data
DfT
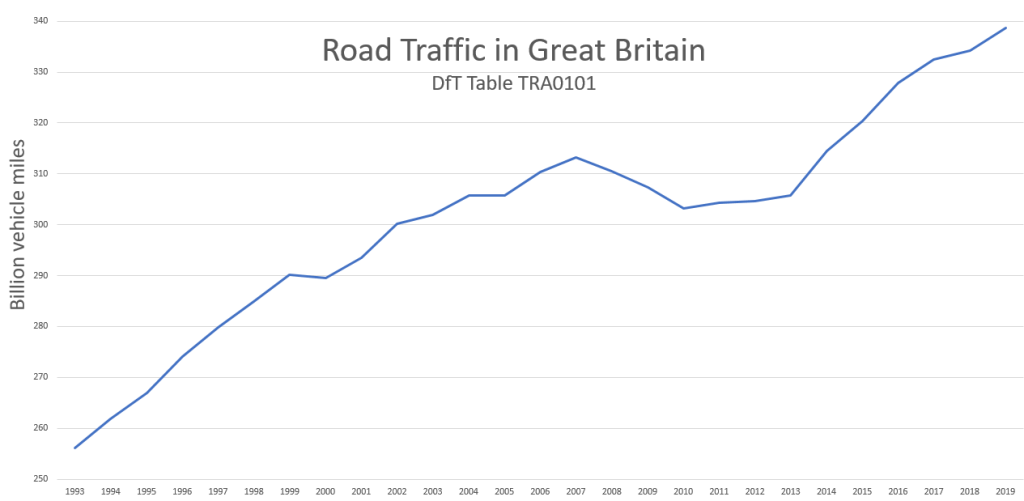
GB
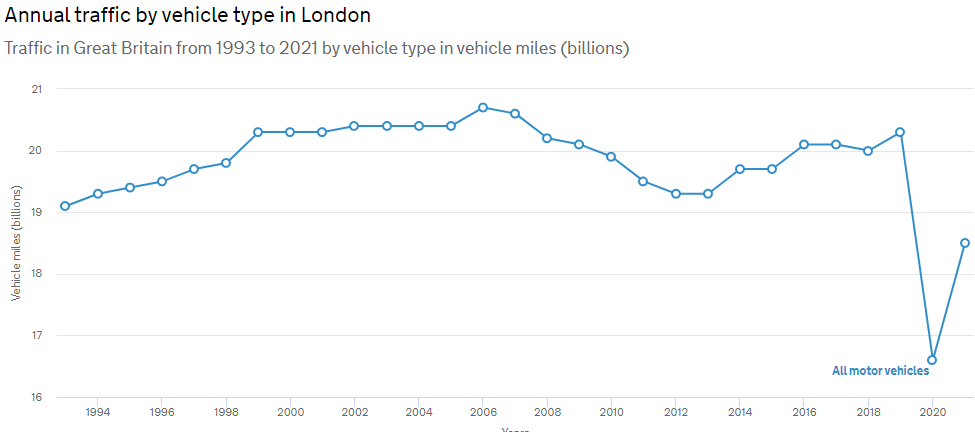
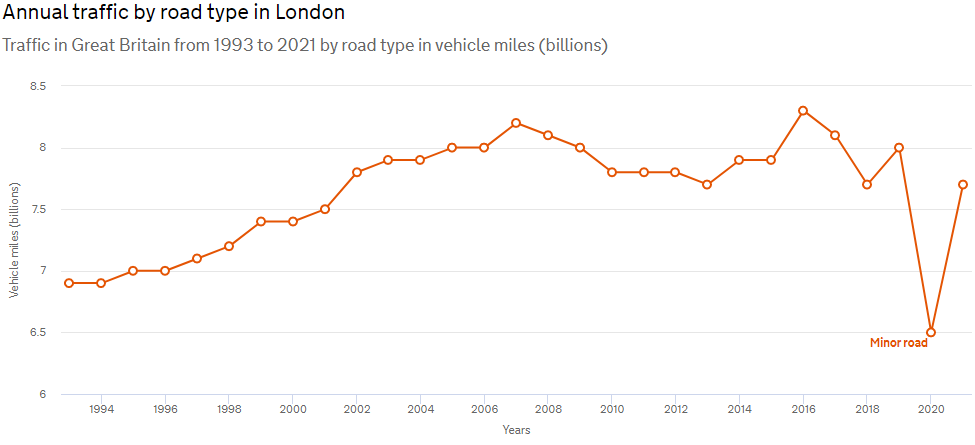
London
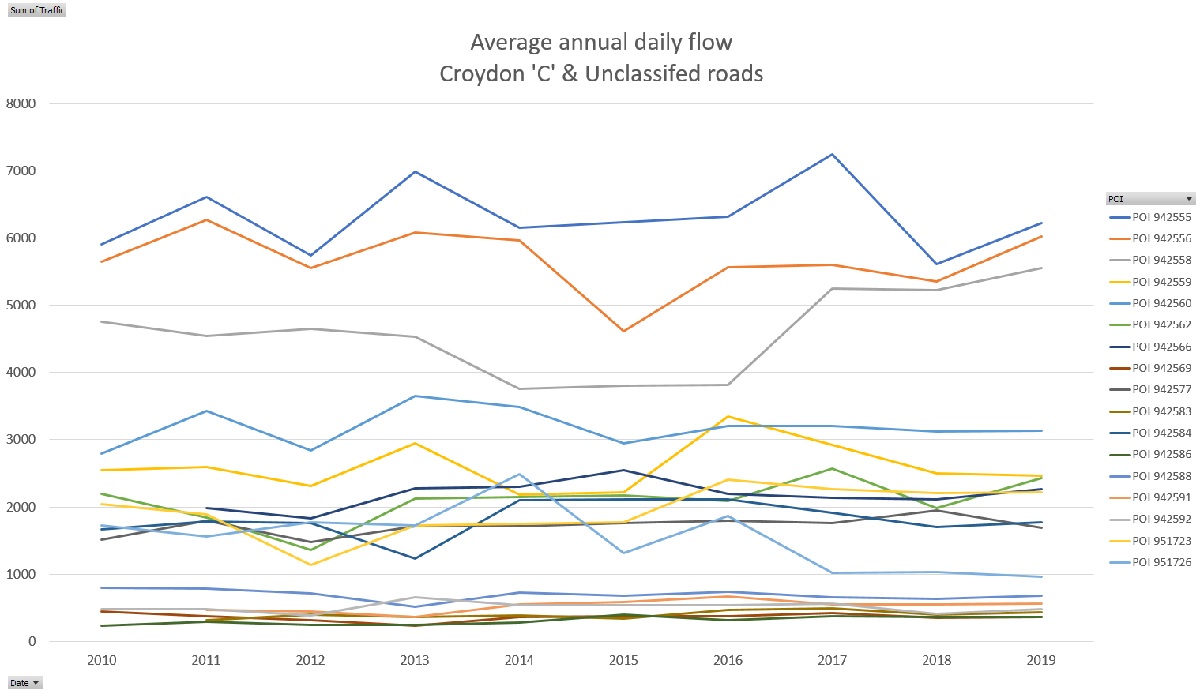
Croydon

DfT comment on above graph: “The traffic count data for a given location can be used to understand the trends for that specific minor road. However individual counts at minor road locations cannot be combined to produce a Local authority level. Traffic estimates for a local authority would need a larger sample size, and can’t be inferred from a limited number of raw minor road counts in that area.”
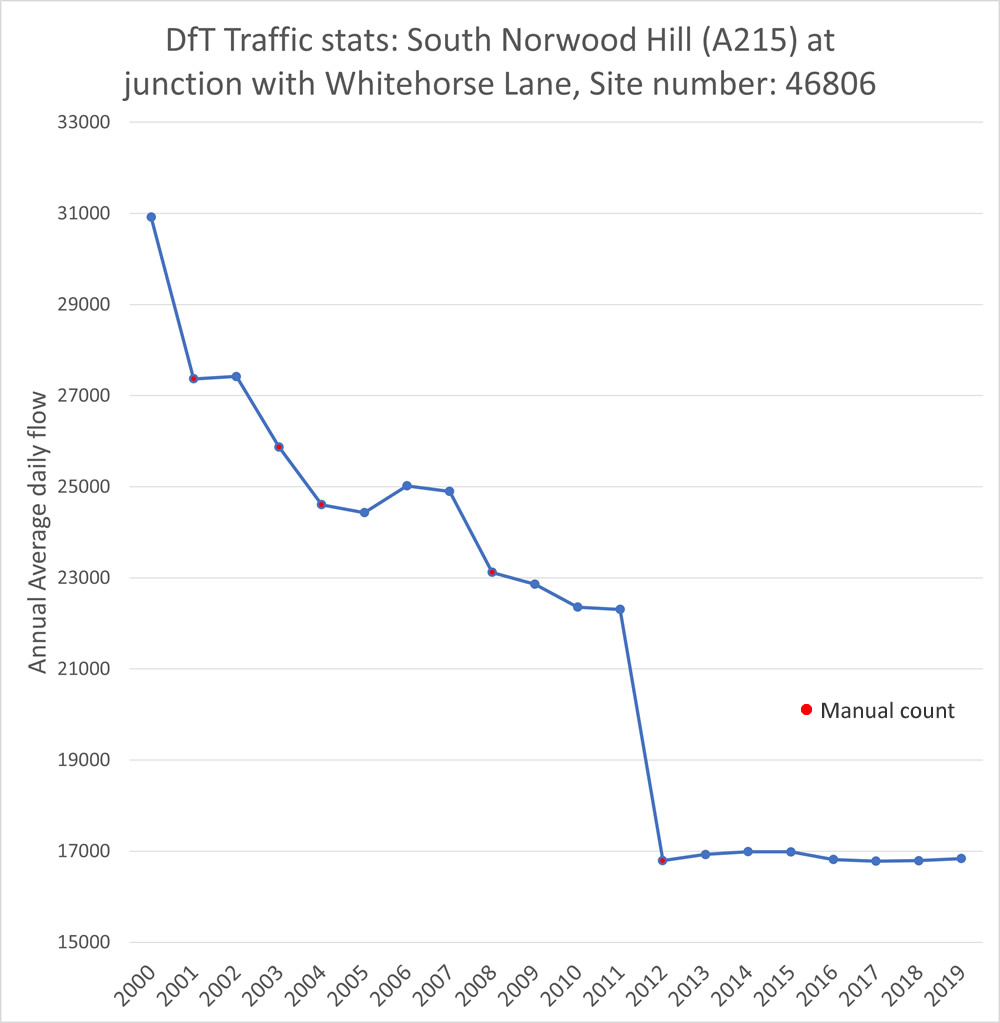
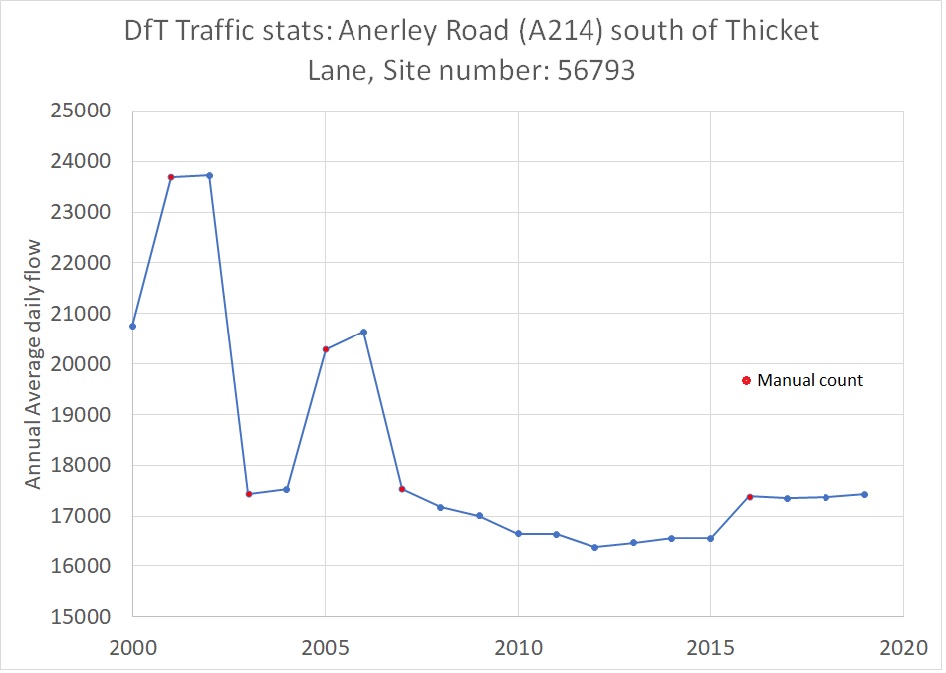
Local main roads
The data points marked ‘Manual count’ are from a typical day between 7am and 7pm. The remainder are estimated.

Within LTN
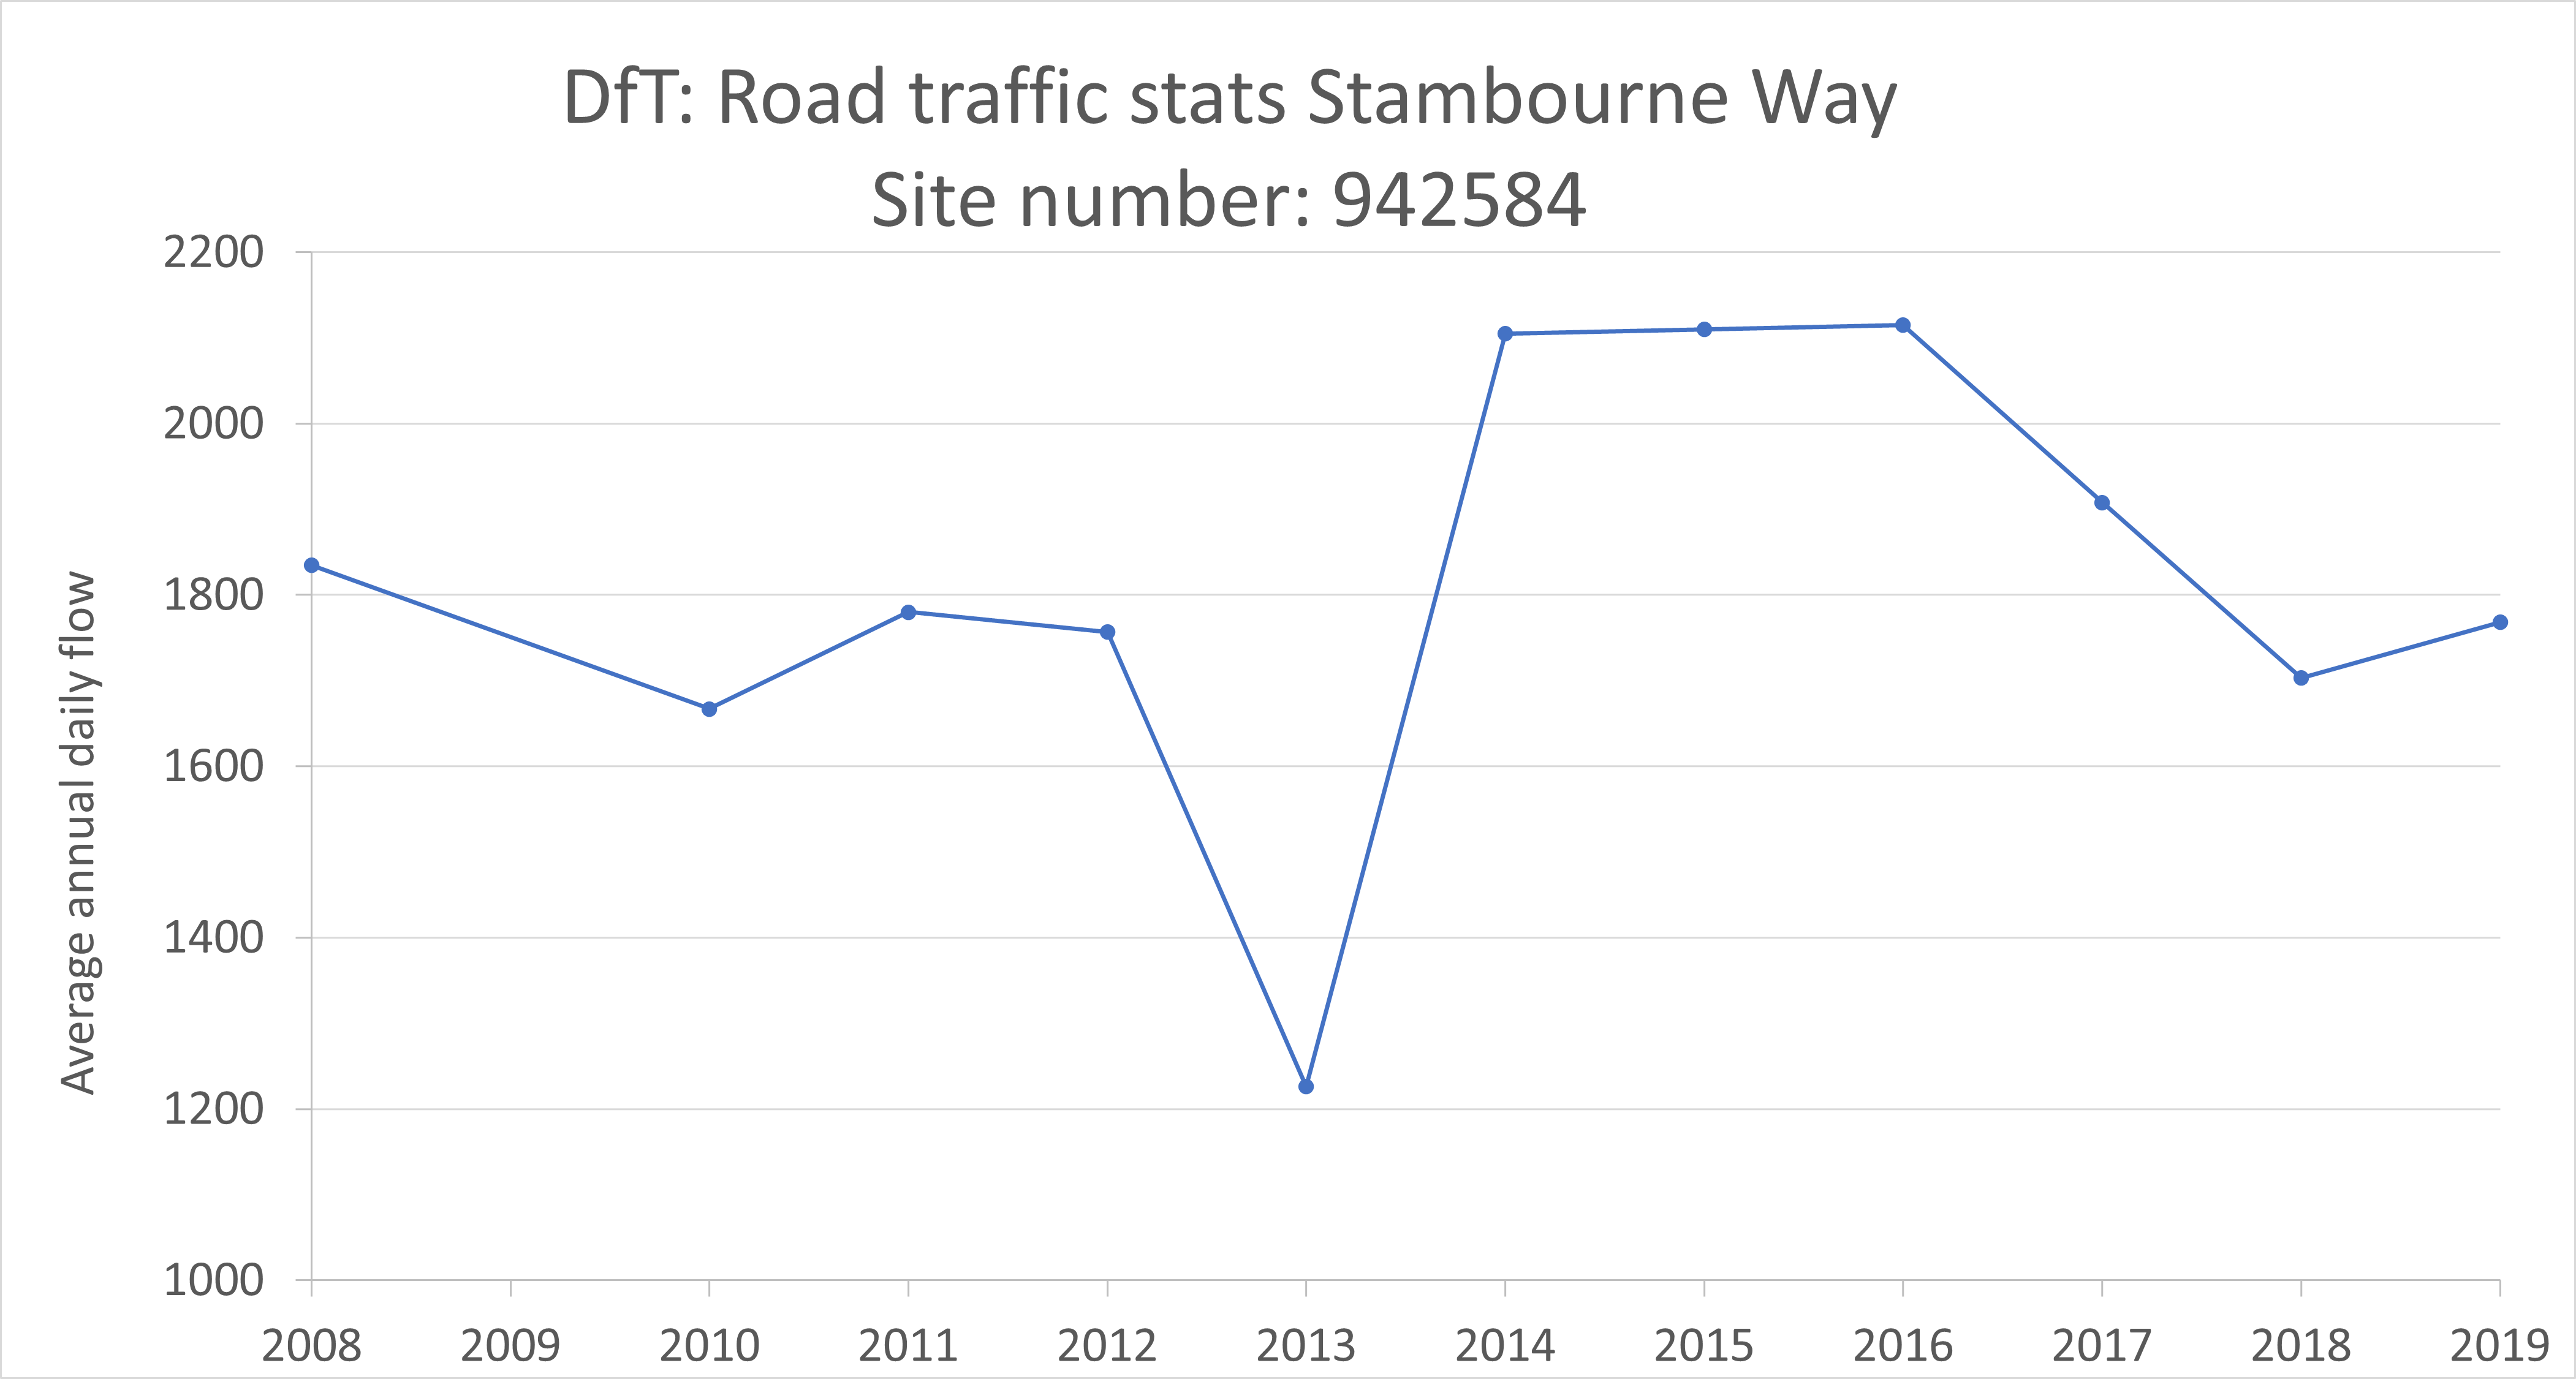
DfT has only measured traffic within the LTN on Stambourne Way, a winding, minor ‘unclassified’ road. All data points were manual counts on a single day between 7am and 7pm, except 2016 when the figure was estimated.
Speedvisor
The Speedvisor is located near the entrance to Stambourne Woods on Auckland Road. It displays speed to drivers approaching from Anerley Hill (North East). It was installed temporarily in 2013, then permanently in 2019 after a serious crash. It can download raw data which can be used to derive traffic counts and speeds. This has been performed three times. [Edit 28/11/2021: Freedom of Information requests have elicited further data.]
The Speedvisor has spectacularly failed to reduce speed. The record in January 2019 was 70mph.
January 2013
Spreadsheet data derived from 12 pdfs supplied by Croydon Council
January 2019
Crystal Palace Transition Town Transport Group: Auckland Road speed survey data (report and raw data) or download spreadsheet from this site
August 2019
Spreadsheet supplied by Croydon Council
Analysis
Comparison of January 2013 with January 2019
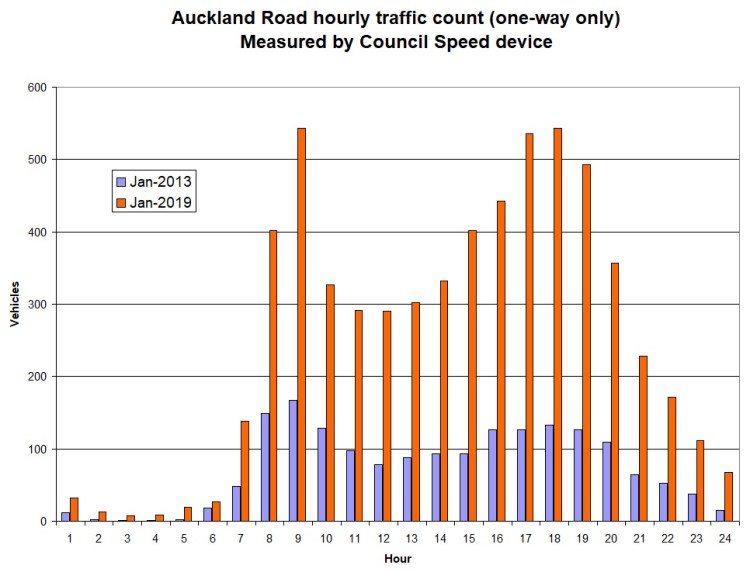
Between 2013 and 2019, traffic increased over three-fold overall but by four times in the evening rush hour.
Telraam
See Telraam traffic counters coming to Crystal Palace for more details about what these citizen monitoring devices are. There are currently 3 in operation locally:
Local citizen counts
- Active travel in the LTN – July & November 2020
- Impact of Crystal Palace LTN on adjacent streets in Bromley
Updates 06/09/2021 & 28/11/2021 – FOI requests
Various Freedom of Information requests have elicited the following Traffic data for the Auckland Road Speedvisor:
| File | Period | Report generated | Notes |
|---|---|---|---|
| FOI-3661737 3 sep 2018 to 15 sep 2018 | 3 Sep – 15 Sep 2018 | 11/12/2018 | Highest count in an hour (one direction only): 61 |
| FOI-3661737 14 Jan 2019 to 21 jan 2019 | 14 Jan – 21 Jan 2019 | 21/01/2019 | This data is identical to the data we have been using in our analysis above which was sourced from Crystal Palace Transition Town Transport Group. Highest count in an hour (one direction only): 838 Max speed: 70mph |
| FOI-3661737 jan 2019 | Jan 2019 | 20/03/2019 | This does not tally with the January data immediately above. Most likely this data was corrupted between recording and generating the report 2 months later. This of course is the data OOR supporters use! |
| FOI-3661737 Feb 2019 | Feb 2019 | 05/03/2019 | Highest count in an hour (one direction only): 611 |
| FOI-3661737 March 2019 | Mar 2019 | 20/03/2019 | Highest count in an hour (one direction only): 534 |
| FOI-3661737 August 2019 | Aug 2019 | 04/09/2019 | Highest count in an hour (one direction only): 482 |
| FOI-3661737 16 Jan 2021 to 21 March 2021 | 16 Jan – 21 Mar 2021 | 21/03/2021 | Highest count in an hour (one direction only): 371 |
| FOI-3661737 1 April 2021 to 30 April 2021 | Apr 2021 | 04/06/2021 | Highest count in an hour (one direction only): 356 |
| FOI-3661737 1 May 2021 to 31 May 2021 | May 2021 | 04/06/2021 | Highest count in an hour (one direction only): 649 |
| FOI-4067037 – Data for month of June | June 2021 | 26/08/2021 | Highest count in an hour (one direction only): 460 |
| FOI-4067037 – Data for month of July | July 2021 | 26/08/2021 | Highest count in an hour (one direction only): 330 |
| FOI-4067037 – Data for month of August | August 2021 | 25/10/2021 | Highest count in an hour (one direction only): 395 |
| FOI-4067037 – data for month of September | September 2021 | 25/10/2021 | Highest count in an hour (one direction only): 439 |
| FOI-4067037 – Available data for part month of October | 1-24 October 2021 | 25/10/2021 | Highest count in an hour (one direction only): 396 |
