One measure of the effectiveness of traffic alterations relies on surveys of traffic, before and after the change. If one looks at the major study (S. Cairns, S. Atkins and P. Goodwin) into ‘traffic evaporation’, we find that traffic is analysed both on the road itself, but also the boundary roads where one might expect traffic to divert to. The effectiveness of traffic evaporation is calculated from the ‘before’ and ‘after’ results of these combined figures.
Of course this assumes that the new conditions are planned sufficiently in advance. In the case of ‘our’ LTN, this was introduced as an emergency in response to government demands that “local authorities make significant changes to their road layouts to give more space to cyclists and pedestrians”. So we should be grateful to local residents who performed a thorough survey of traffic in and near the road we wish to protect (Auckland Road) for safe travel by walkers and cyclists. Highlights of the survey follow.
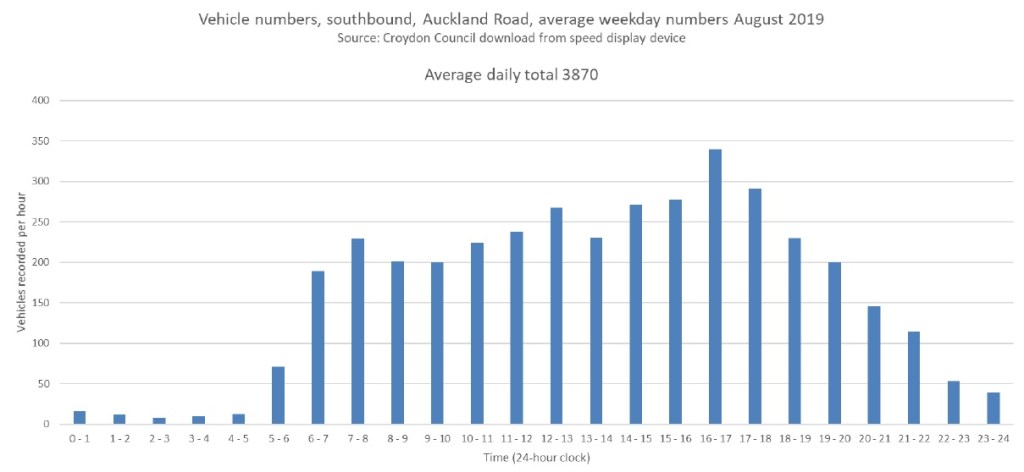
This shows weekday vehicle numbers (south-bound only) from the council speed display device in Auckland Road for August 2019. The average weekday total was 3870 – implying a total in both directions of at least 7,500. High traffic volumes were not limited to peak hours. Traffic exceeded 100 vehicles per hour continuously from 6am to 10pm.
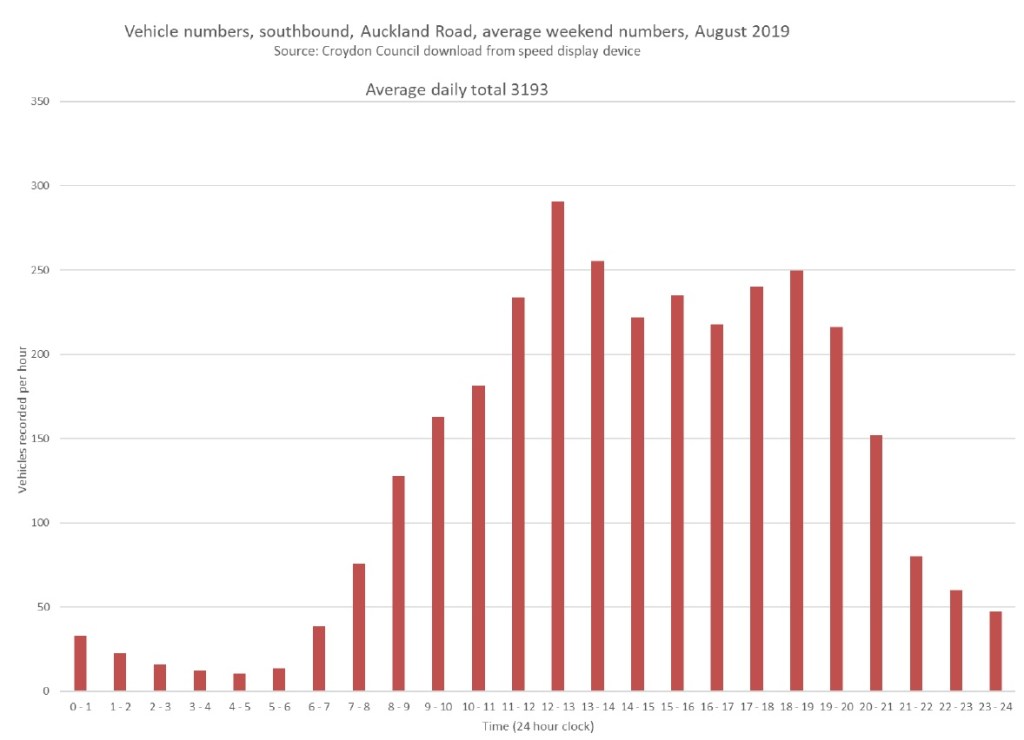
This shows weekend vehicle numbers (southbound only) from the council speed display device in Auckland Road for August 2019. The average weekend daily total was 3193 – implying a total in both directions of at least 6,000. High traffic volumes (over 100 vehicles an hour) were recorded continuously from 8am to 9pm.

This shows vehicles per hour in Sylvan Hill on 24 June 2020, measured from 5.30am to 10.30pm by local residents. Sylvan Hill attracted the most ‘rat-run’ traffic when the gas works blocked Auckland Road at the junction with Cypress Road. Like the council counts from the previous summer, the heavy traffic was not limited to peak hours: there were over 100 vehicles per hour at all times from 7.30am to 10.30pm.

The full report gives more detail of the surveys, traffic speeds and effects on neighbours.
- Crystal Palace Transition Town Transport Group – Auckland Road speed survey and raw data
