
This brings together resident data about active travel at two locations in the LTN:
- on Sylvan Hill, where there is data for both July and November
- at the Sylvan Hill/Auckland Road crossroads, where there is data only for November.
Sylvan Hill
If active travel sceptics are to be believed, Sylvan Hill is not the most favourable environment for walking and cycling. There is an ascent of 27 m in about 325 m of distance, an average 1:12 gradient, although one section is 1:7. However, it is the only location where we have data from before and after the installation of the LTN. The street is the location of one of the LTN’s modal filters and has therefore become, effectively, two cul-de-sacs.
Whatever view one takes of the extent to which the area’s topography discourages active travel, the number of people walking and cycling on the street has increased significantly since the summer.
Figure 1 shows hourly estimates[1] of the numbers of people walking (in both directions) between 7 am and 7 pm in July and November.
The comparison is not like-for-like in an important respect. In July, there were few if any students of Harris City Academy Crystal Palace attending, whereas the school is currently functioning fully. Students account for a large proportion of the distinct peaks seen in the graph in the early morning and mid afternoon, since Sylvan Hill is one of the main walking routes to the school. However, even removing 500–600 Harris student movements from the total, there has still been around a threefold increase in walking.
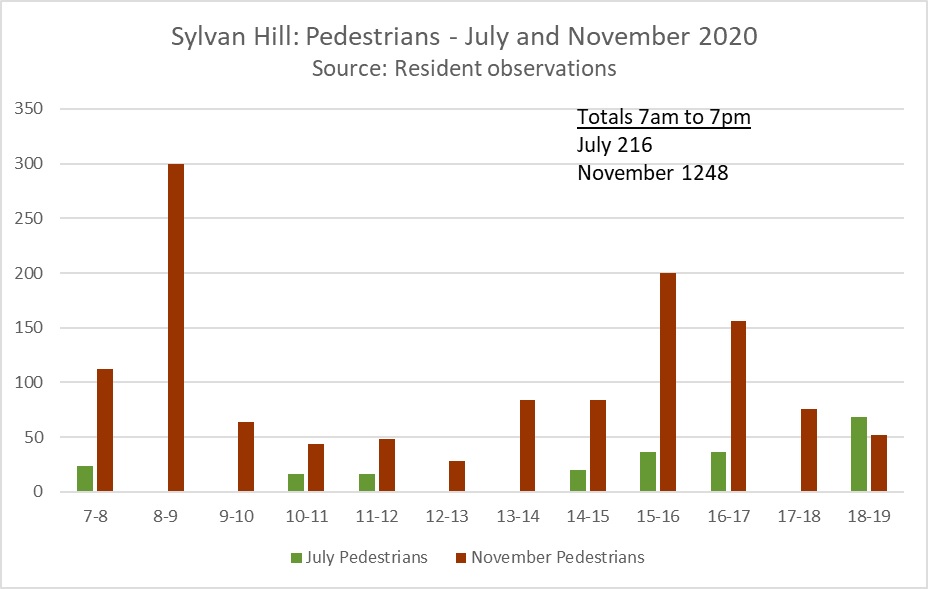
Figure 2 (below) shows hourly estimates of the numbers of people cycling (in both directions) between 7 am and 7 pm in July and November.

Total numbers have nearly tripled since the summer. During the morning commuting phase (7–9 am), there were approximately 60 cycle movements. While not counted separately, a considerable proportion of these were parents with children (on child seats or in cargo bikes or trailers). (Respect to these parents who are tackling the hill!)
Sylvan Hill/Auckland Road crossroads
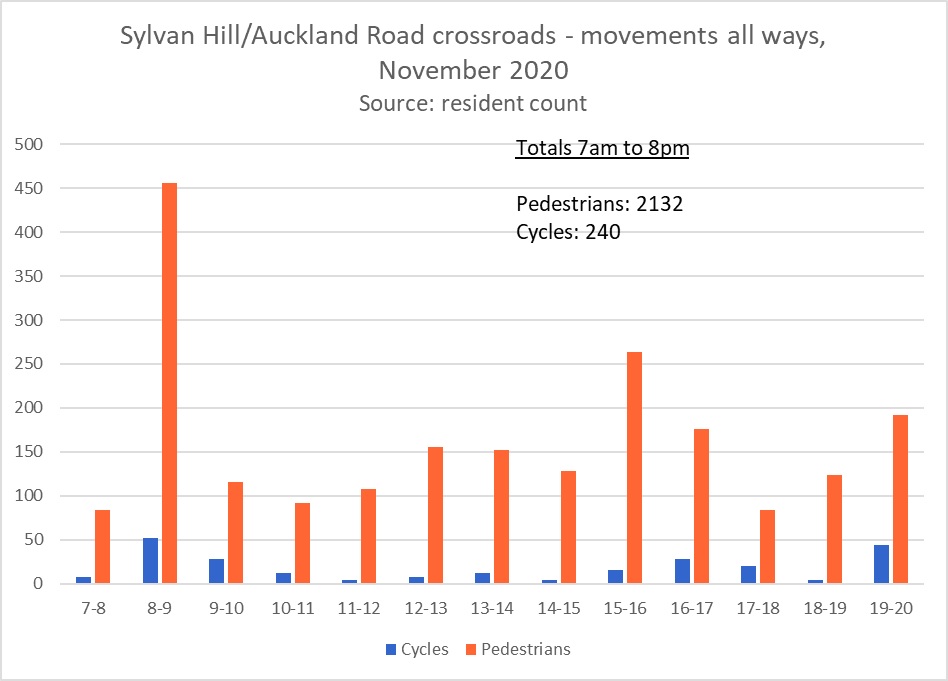
Figure 3 below shows the results of a pedestrian and cycle count at this location. There is no July data, but the results are nonetheless informative: some 240 cyclists passing through the junction during the course of the day, or around one every three minutes; and over 2100 pedestrians passing through the junction. As with the Sylvan Hill count, several hundred of these movements are of Harris students, but there is an enormous amount of general footfall at this location too.
Observations and conclusions
We make three points.
First, what is the most likely reason why there is more walking and cycling than in the summer in Sylvan Hill? In July, the street was being used by several hundred motor vehicles an hour for most of the day, with associated poor air quality and noise. Worse, driver behaviour was often poor, with speeding, driving and parking on pavements, and aggression towards cyclists and pedestrians. It is highly unlikely that any parent would have contemplated transporting young children by cycle.
It is now quiet and pleasant. Cycling uphill is hard work, but – as the figures show – not impossible, and it can now be done with minimal interaction with motor vehicles.
Second, the importance of Sylvan Hill and the crossroads with Auckland Road as a walking corridor for Harris students. This would presumably continue to be the case if Sylvan Hill were open to motor vehicles: it has always seen large numbers of students at peak times. The difference now is that they are less exposed to poor air quality and traffic danger. The LTN has also reduced traffic on other walking corridors for Harris students, and around the school entrance. An important part of the case for continuing with the scheme should be never again to expose students to unacceptable air quality and danger on their way to and from school.
Third, opponents of the LTN frequently claim that no one walks or (especially) cycles in the LTN. They suggest this both shows that the LTN has not in fact encouraged active travel, and that it creates a ‘deserted’ environment which is ‘unsafe’. The evidence in this note shows that, in fact, there is a considerable amount of cycling and masses of walking. That level of active movement is both a good thing in its own right, and because it supports social safety. People out and about on the street are seldom out of eyeshot of other people walking and cycling, which is both reassuring and an obvious deterrent to street crime.
Shape Better Streets
1 December 2020
[1]Based on 15 minute counts at the half hour
