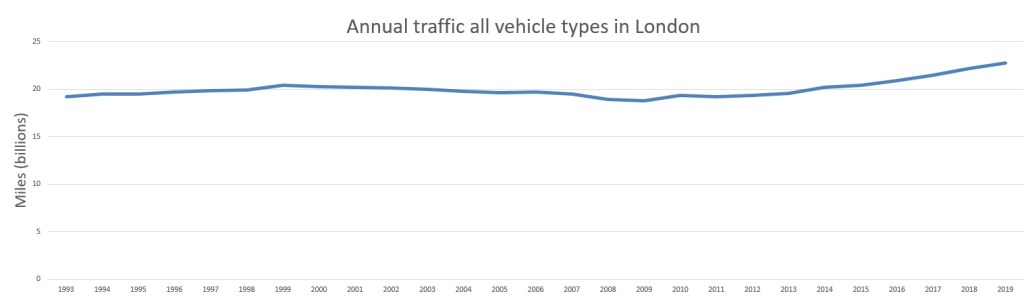
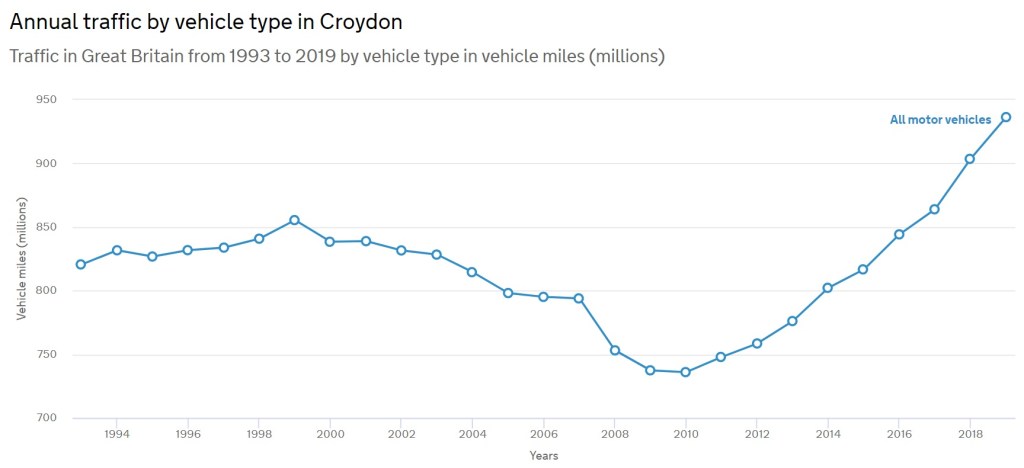
Rise in traffic in London and Croydon
It looks like a fairly modest increase in traffic over the last 27 years in London. Less than 1% per year. But still an additional 3.5 billion miles.
But look closer to home and Croydon traffic has increased by 200,000,000 miles between 2010 & 2019.
More disturbing, the Department for Transport has also published statistics that show that traffic increased by 72% (3.9 billion miles) on London’s residential roads between 2009 and 2019. This period coincided with the advent and uptake of sophisticated advances in satellite navigation technology, specifically the ability to route around traffic congestion.
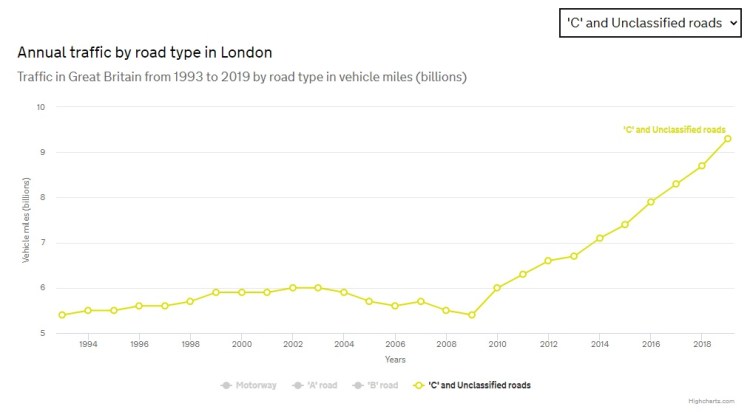
But the DfT statistics fail to show how traffic has increased specifically on rat-run roads, because their measurements are spread over ALL residential roads.
Auckland Road, a powerful and disturbing case study
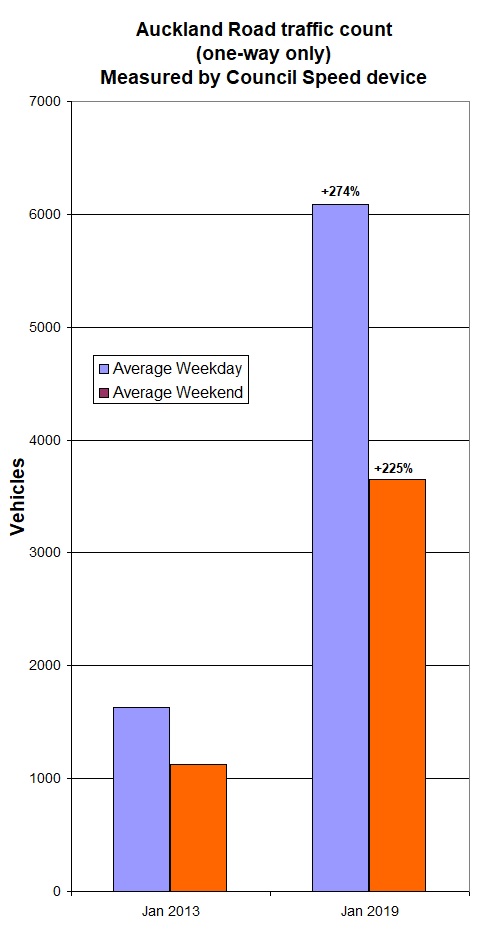
Most rational observers would have suspected that rat-run traffic was much worse, but it still comes as a shock when a speed device reveals to what degree.
Croydon Council installed a speed device (SpeedVisor which can record speed and vehicle numbers) on Auckland Road near the bottom of Stambourne Wood. Apart from speed, they also measured vehicle numbers going in a single direction. Data was recorded for two weeks in 2013 (14-27 January) and one week in 2019 (14-20 January).
So to summarise:
- Traffic has increased by 72% on residential roads over the 10 years between 2009 and 2019, but
- Traffic has increased by 274% on Auckland Road over the 6 years between 2013 and 2019
- The 2019 traffic levels are higher than at least one of our nearby proper main roads, Central Hill; see Tom Chance’s recent blog
Now let’s look at how traffic has increased throughout the day:

(One way) we have gone from just 8 hours with >100 vehicles in 2013 to 13 continuous hours with >290 vehicles in 2019. At peak, one vehicle every 7 seconds in each direction.
Auckland Road has been for many years part of an official London cycling route (LCN29) from Croydon and on through the park to Dulwich and beyond. The increase in traffic has taken it way past the level where TfL would fail it as a cycling route without heavy infrastructure like proper cycle lanes and junction improvements. It is no wonder cycling was pitifully low when we did our counts in the summer.
Conclusion
Opponents of the LTN sometimes say Auckland Road and surrounding streets were quiet streets, or (in complete contradiction) that they have always been busy. This data shows neither claim is true. Aided and abetted by satnav, the cars came and stole our neighbourhood.
One has to wonder why it has taken us so long to bring in measures to push back this traffic.
Update 2 December: Data is your friend
We are pleased that so many social media warriors have put such an effort into repudiating the data behind this analysis. They’ve scrolled down through all the DfT data that shows the general case that traffic on London’s residential roads has sky-rocketed and homed into the statistics provided by the Council’s speed device in January 2013.
The ‘data-refuters’ rarely come up with any evidence themselves, but this time they point out that the weather was particularly severe that month, and therefore the traffic count was too low. Not being used to examining data, they concentrate on the headlines, but ignore the detail. So they have come up with the Met Office’s Widespread snow January 2013 which fair enough does say “This period brought the most widespread and prolonged snowfall in the UK since November and December 2010”. And sure enough, Little Rissington got 30cm of snow. But only one sentence referred to our area: “Further snowfalls affected southeast and eastern England on the 19 and 20 January.” These two days were Saturday & Sunday, so not included in our comparison of weekday traffic which showed an increase of 274% over six years (almost quadrupled).
Mention has also been made of the low temperatures. On the 17 & 22 January, night-time temperatures plummeted to -6°C. So therefore, people stopped driving. Unfortunately, the stats reveal that traffic was above the average on these two days and on the 17 January, 141 drivers managed to exceed 30mph.
Wisely only few of the data-refuters mention the Achilles heel of the SpeedVisor because it would destroy their case. Apparently, the device can occasionally miss a vehicle if it is too close to the one in front. Most likely this would happen if the average interval between cars was 7 seconds, rather than 21 seconds. So, are they claiming the increase in traffic should be higher?
For the record
The supporters of the LTN are not just interested in making our own backyard safe and quiet. It is an essential area for people to safely exchange driving their cars (on main roads too) in favour of active travel. LTNs are the first step to developing a liveable city, where cars do not dominate.
Holland is not the only place where this works!
Data from speed device (one direction only)
Daily 2013
| Date | Day | < 30 mph | < 40 mph | < 50 mph | Total | Comment |
| 14-Jan- 2013 | Mon | 1108 | 53 | 1 | 1162 | |
| 15-Jan- 2013 | Tue | 1678 | 90 | 0 | 1768 | |
| 16-Jan- 2013 | Wed | 1664 | 125 | 1 | 1790 | |
| 17-Jan- 2013 | Thu | 1618 | 138 | 3 | 1759 | -6°C |
| 18-Jan- 2013 | Fri | 1348 | 49 | 2 | 1399 | Schools close early |
| 19-Jan- 2013 | Sat | 1154 | 27 | 1 | 1182 | Snow fall |
| 20-Jan- 2013 | Sun | 667 | 6 | 0 | 673 | Snow fall |
| 21-Jan- 2013 | Mon | 1168 | 16 | 0 | 1184 | |
| 22-Jan- 2013 | Tue | 1699 | 103 | 3 | 1805 | -6°C |
| 23-Jan- 2013 | Wed | 1535 | 118 | 4 | 1657 | |
| 24-Jan- 2013 | Thu | 2145 | 153 | 3 | 2301 | |
| 25-Jan- 2013 | Fri | 1363 | 85 | 3 | 1451 | |
| 26-Jan- 2013 | Sat | 1755 | 139 | 1 | 1895 | |
| 27-Jan- 2013 | Sun | 688 | 56 | 2 | 746 | |
| Total | 19590 | 1158 | 24 | 20772 | ||
| Average | Weekday | 1628 | ||||
| Average | Weekend | 1124 |
Daily 2019
| Date | Day | Vehicles |
| 14-Jan-2019 | Monday | 8783 |
| 15-Jan-2019 | Tuesday | 6074 |
| 16-Jan-2019 | Wednesday | 5173 |
| 17-Jan-2019 | Thursday | 5271 |
| 18-Jan-2019 | Friday | 5118 |
| 19-Jan-2019 | Saturday | 4040 |
| 20-Jan-2019 | Sunday | 3258 |
| Average weekday | 6084 | |
| Average Weekend | 3649 |
Hourly comparison
| Hour | Jan-2013 15 January | Jan-2019 Average 14-18 January |
| 1 | 12 | 32 |
| 2 | 2 | 13 |
| 3 | 1 | 7 |
| 4 | 1 | 8 |
| 5 | 2 | 19 |
| 6 | 18 | 27 |
| 7 | 48 | 138 |
| 8 | 149 | 401 |
| 9 | 167 | 543 |
| 10 | 129 | 327 |
| 11 | 98 | 291 |
| 12 | 78 | 291 |
| 13 | 88 | 303 |
| 14 | 93 | 332 |
| 15 | 93 | 402 |
| 16 | 126 | 443 |
| 17 | 126 | 535 |
| 18 | 133 | 544 |
| 19 | 126 | 492 |
| 20 | 109 | 356 |
| 21 | 64 | 228 |
| 22 | 53 | 172 |
| 23 | 37 | 112 |
| 24 | 15 | 68 |
| Totals | 1768 | 6084 |

Would that be January 2013 when London temperatures got to -6 degrees and it snowed lightly and heavily for several days over that measured two week period? Whilst Jan 2019 was positively balmy with day time temperatures of +6 degrees and guess what – no snow at all! I wonder why there was less traffic measured in that Jan 2013 two week period?
LikeLike
Thanks Daniel for your entertaining reply. You can be relied upon to challenge the data. It’s just a shame that the day when the temperature was recorded at -6 degrees was Tuesday 22 Jan and perchance that day had way more traffic than the day before or the day after. Maybe the traffic in 2013 was so high because it was cold so people used their cars more, while in 2019 the balmy weather encouraged people to do the right thing and walk.
LikeLike
Some more about the weather. Tuesday 22 January was when the temperature reached -6 degrees. But rather than stopping people driving, that day recorded over the average vehicle movements for the two week period. That day also recorded way over the average number of vehicles exceeding 40mph. The speed device failed to record whether these cars were slithering sideways at the time, nor could it address the logic of more cars when there should really have been less in these adverse weather conditions.
LikeLike
So the “analysis” has gone from averaging traffic over a two week period. When it was brought to your attention – I’ll be gracious and believe you wouldn’t honestly have intentionally picked those two weeks in 2013 to show the greatest difference – that the periods weren’t comparable due to verifiably different road conditions in that it snowed for several days, schools had to close, etc. etc., the supporting “evidence” has switched to referencing one single day seven years ago and using that as your data point to validate your claim that traffic on Auckland Road has increased 274%. I trust you and anyone else that reads these posts can see how disingenuous and misleading the claim is. Also as a mature responsible adult you should use the data to support your case, if the data is not on your side, you shouldn’t use to spread misinformation and falsehoods.
LikeLike
Normally we wouldn’t approve such a rude, misleading comment, but this time we will because it illustrates the methodology of those who have run out of argument. These opponents of the LTN have no solutions to the overuse of cars in our towns and cities, and all they can do is to attempt to destroy the data that is proof to its necessity.
So to answer:
“So the ‘analysis’ has gone from averaging traffic over a two week period” – the analysis hasn’t gone anywhere, it still stands, is based on verifiable facts and remains the basis of the stated 274% increase in traffic.
“… you wouldn’t honestly have intentionally picked those two weeks in 2013 to show the greatest difference” – we came upon these statistics quite by accident, provided by the councils Highway dept about four years ago. It was just luck that we also had a week’s data from January 2019, so we thought it would be worth comparing.
“the supporting ‘evidence’ has switched to referencing one single day seven years ago and using that as your data point to validate your claim that traffic on Auckland Road has increased 274%” – we haven’t SWITCHED data, the 274% increase is still based on the average weekday traffic over the complete periods. In answer to your original comment, we EXPANDED our analysis to look at a day when the temperature was -6 degrees. So rather than go over old ground, I’ve looked at the weather in January 2013, and in fact there were two days when the the weather was -6 degrees – 17 January and 22 January. Your intent was to prove that this extreme weather resulted in artificially low traffic, but if you look at the daily figures above, you will see that traffic on those two days was well over the average for the two weeks.
I will leave it to our readers to decide how disingenuous and misleading our report is and who is dealing in misinformation and falsehoods. The methodology of twisted logic and angry invective is unfortunately too common these days, but hopefully with the dethronement of Trump, it is on the wane.
LikeLike
Fantastic and alarming analysis.
I’m a resident and big LTN supporter
Thank you for pointing out how important it is to change our ways. I can’t believe I used to drive to the triangle. So much better on foot or scooter in my opinion. Kids walk 35 mins to school and it’s just part of their day now.
LikeLiked by 1 person
Thanks Caroline. Hopefully you have completed the Council consultation. See: https://crystalpalaceltn.org/2020/11/10/shape-better-streets/
LikeLike
Very impressive research, and as noted above, alarming.
I wonder if Croydon Council will see this analysis.
LikeLike
Thanks Edward. It was the result of a lot of work by a great team of supporters. It is going the council’s way tomorrow.
LikeLike