The phenomenon of evaporating traffic is so interesting that we devote a sub-section to it on our Resources page. Opponents of LTNs all over the world like to claim that restricting traffic in one area just displaces it to another. This may well happen over a short period, but quite quickly, enough people change their mode of travel so that overall traffic reduces and in some cases it even happens on the boundary roads.
But now for something completely different.
This post is going to look for a more mysterious form of disappearing traffic, as it has apparently occurred without intervention, nobody has spotted it nor divined where it might have gone.
We have been used to putting up with traffic congestion around Crystal Palace for a long time. Tom Chance made a plea to reduce traffic in May 2014. But nobody has examined how traffic has changed on the main roads surrounding the LTN. So it is going to come as a shock that traffic has reduced significantly on all three main roads.
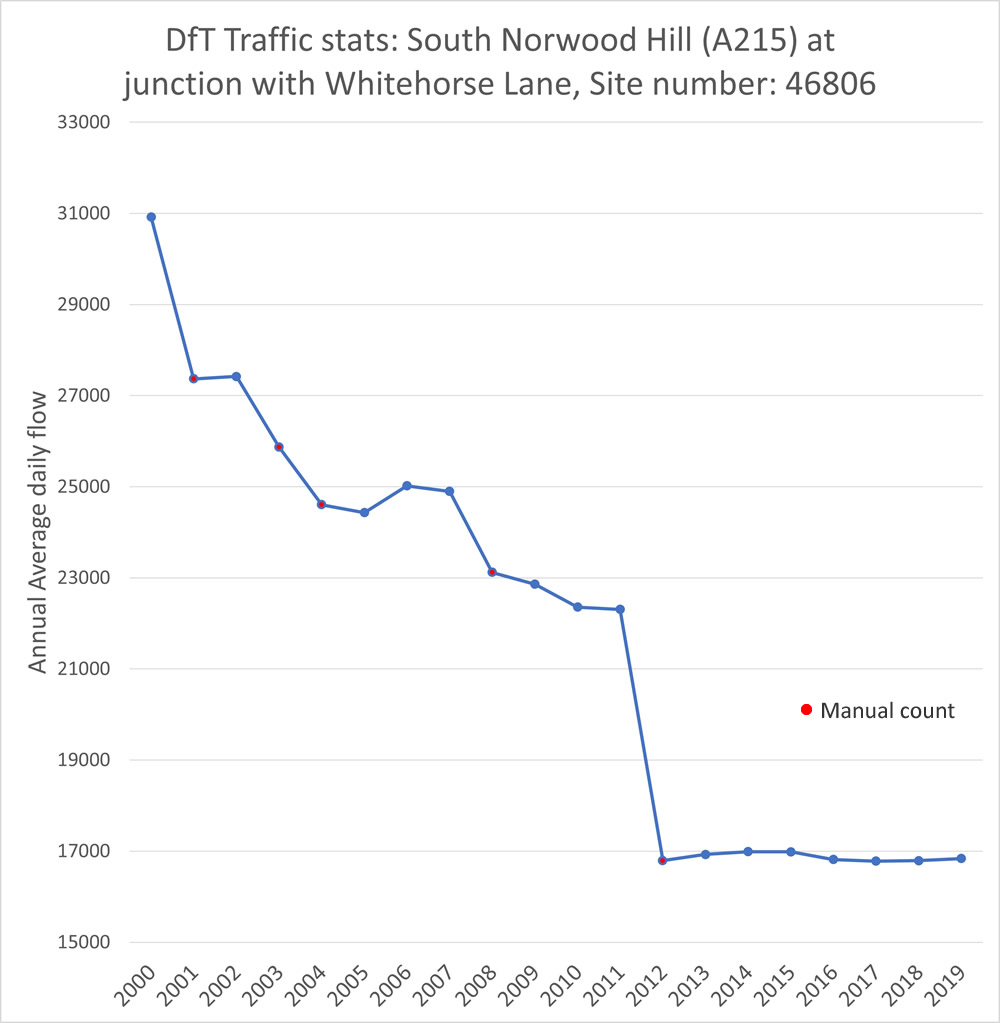
Traffic on South Norwood Hill has almost halved between 2000 and 2019. 14079 vehicles a day have simply disappeared.
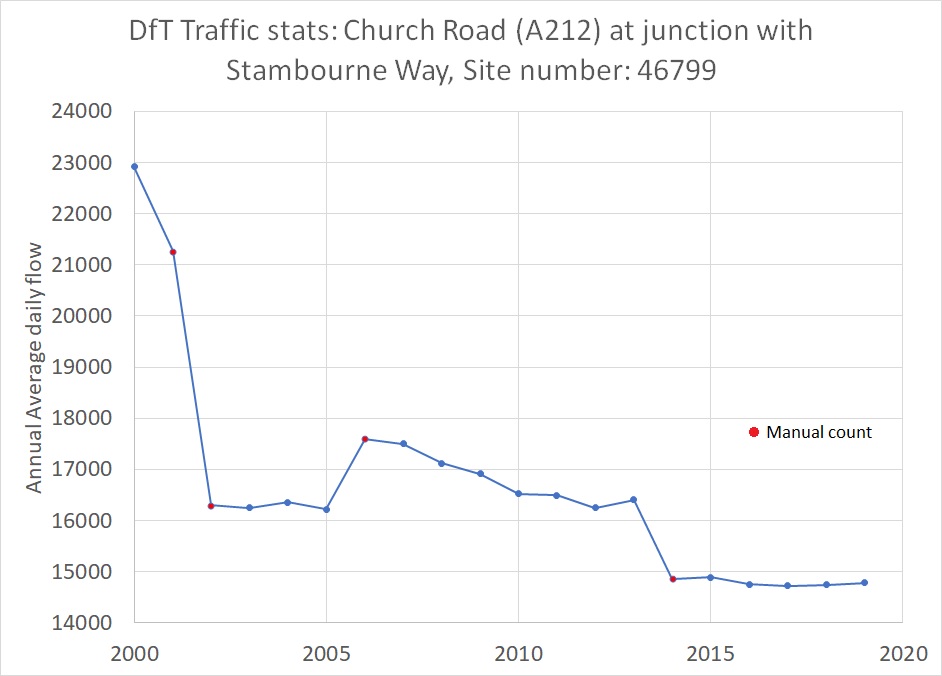
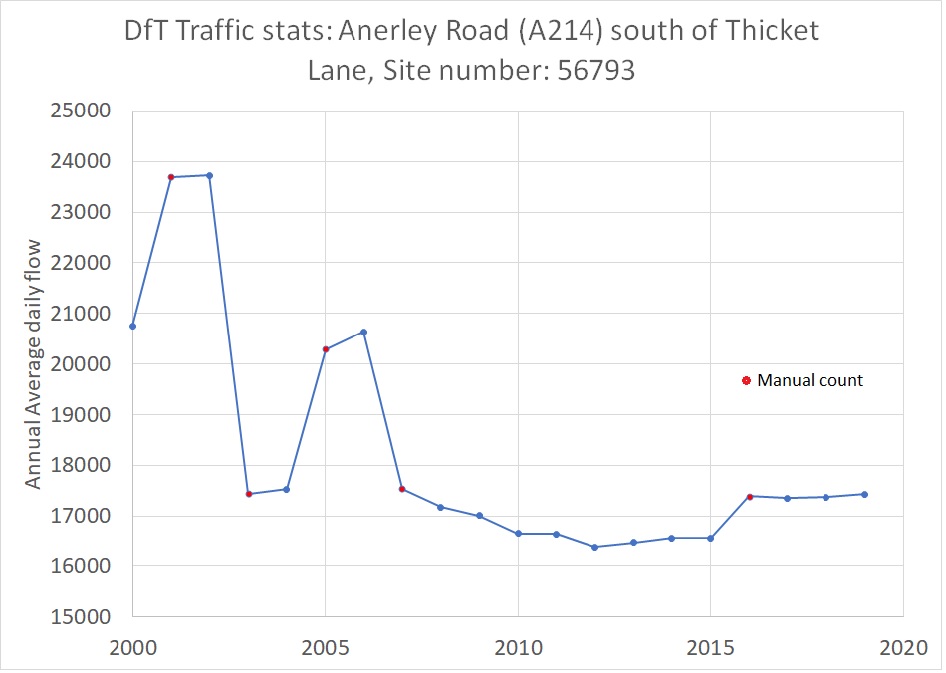
A similar but not so dramatic scenario appears on Church Road and Anerley Hill.
OOR have done a magnificent job of demonstrating that traffic has not increased on ‘C’ and Unclassified roads where the Council has measured it. Indeed it is the only data they have produced about traffic!

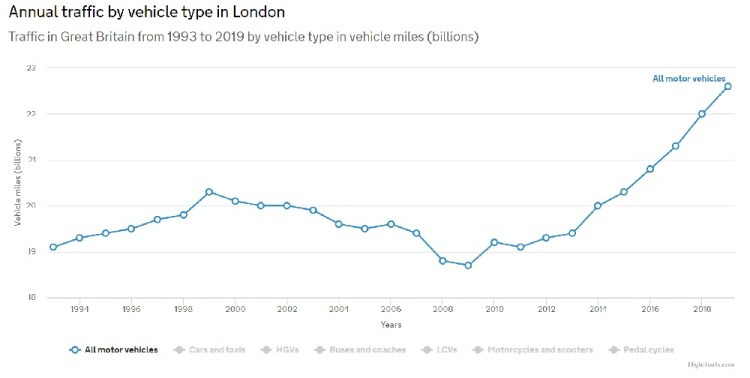
Given that Croydon traffic has increased by 200,000,000 miles between 2010 & 2019 nobody could suggest that everyone is just driving less.

So to recap:
- traffic has increased massively overall in Croydon
- traffic has reduced significantly on the main roads around the LTN
- not much has changed on the minor residential roads surveyed
We seek it here, we seek it there…
We have to ask what other roads do we have around here where this traffic might have mysteriously disappeared to? Supposition – it might be rat-run roads.
Let’s test this out.
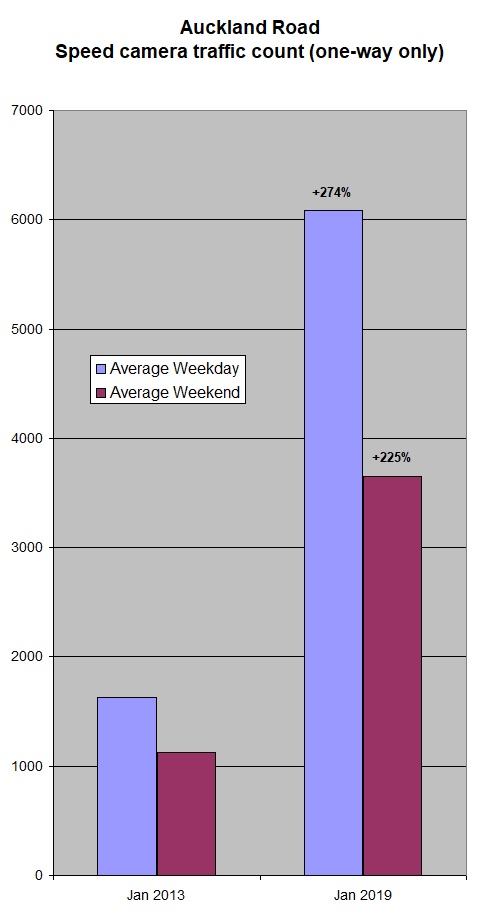
There are no official traffic counts for any roads within the LTN, but almost fortuitously we managed to find two sets of data recorded by the speed device situated on Auckland Road, the very centre of this controversy.
LTN opponents have gone to ridiculous lengths* to undermine this data because it reveals:
- that the ‘missing’ traffic is not really missing
- it has diverted to rat-run routes
- traffic on Auckland Road almost quadrupled between January 2013 and January 2019.
[For an explanation about one of the key drivers for changing traffic patterns see Satellite Navigation: benefit or bane?]
Another mystery resolved.
The general proposition evidenced in TfL’s overall traffic figures is there has been a massive increase in London’s traffic and that most of this traffic has deviated onto residential roads is borne out in our own locality.
* It seems almost churlish to reveal how anxious LTN opponents are to destroy the validity of this data. They point to the extreme weather conditions in January 2013, but the days with the lowest temperatures had above average traffic. Two days had snow but this was on the weekend and on the preceding Friday day schools closed early. Cars also managed to exceed 40mph on the day the schools closed and on both days when the temperature dropped to -6°C. Weather didn’t deter the speeders then.
Even if we exclude data from the day schools closed, traffic increased 3.7 times from 2013 to 2019.
