It is the season to be magnanimous so it is only fitting that we should admit that opponents of the LTN have finally supplied the killer blow to our attempts to demonstrate that traffic patterns over the last 10 years prove the need for the LTN.
Hubris always prevails when you think you have an overwhelming case.
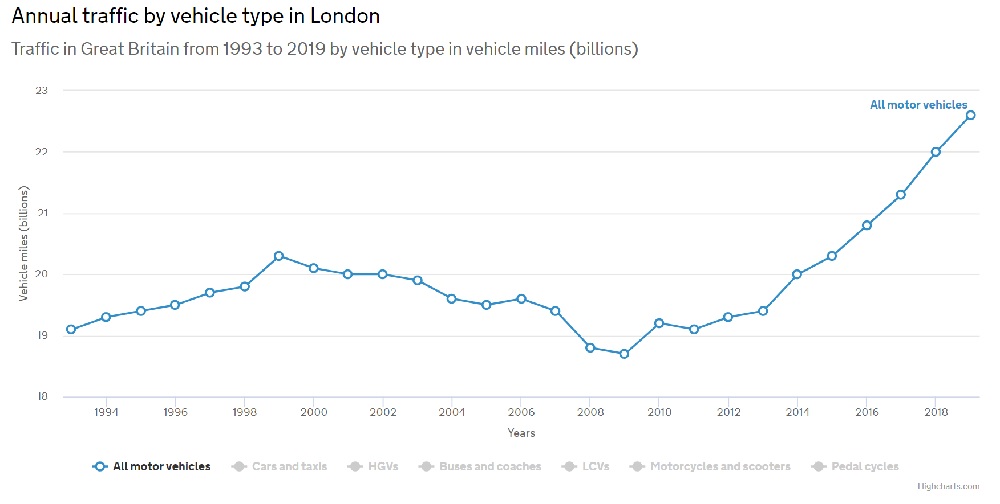
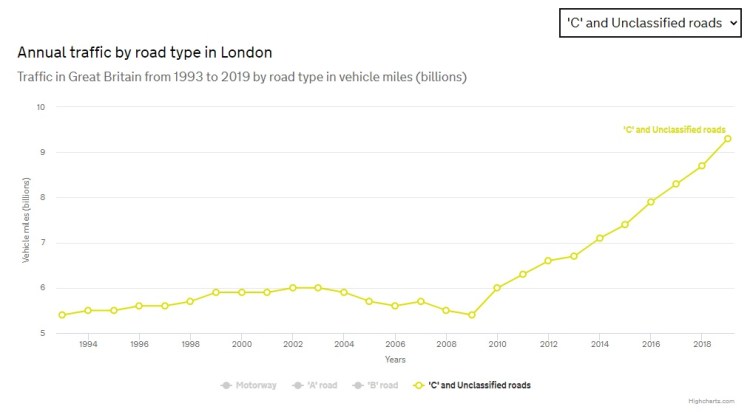
Like the fact that traffic in London has increased by 3,900,000,000 miles in London between 2009 and 2019 and almost doubled on residential roads (‘C’ and unclassified).
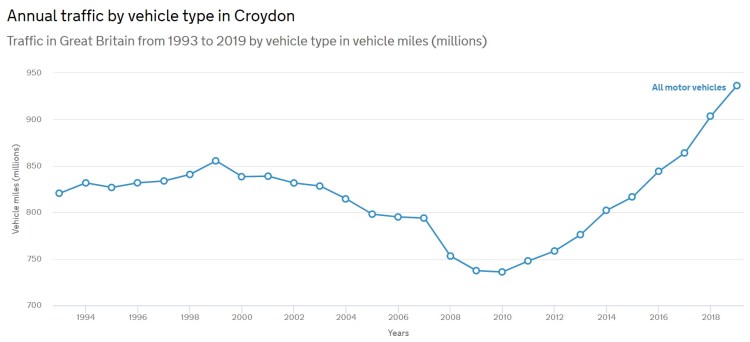
While closer to home, Croydon traffic has increased by 200,000,000 miles between 2010 & 2019.
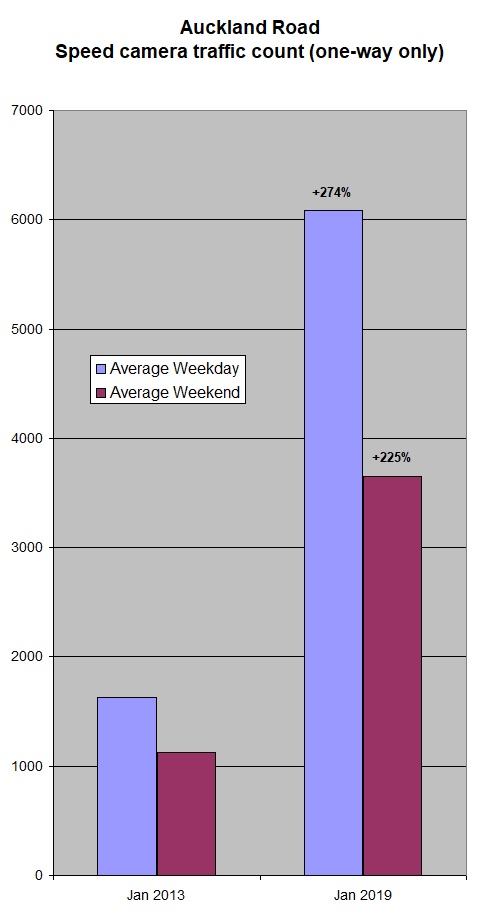
Then when we found that data from the speed device on Auckland Road showed that traffic had increased 3.7 times over the six years from 2013 to 2019, we thought we had the complete deck of cards.
Little did we suspect that lurking in the shadows was the evidence that would trounce all this.
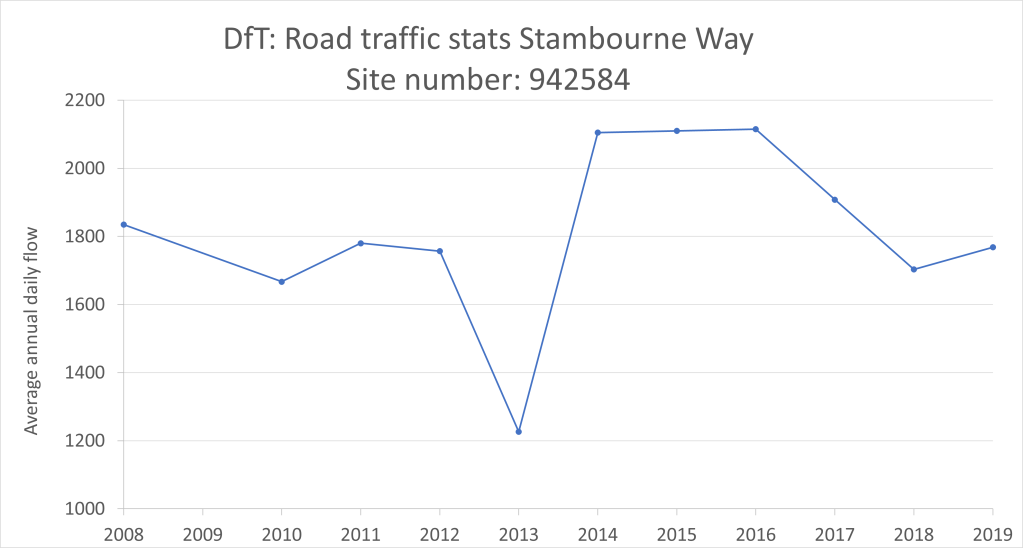
So without further ado, we announce… traffic on Stambourne Way. We can see that traffic has hardly increased at all between 2010 to 2019 – a mere 6% or 101 vehicles a day. So a simple extrapolation points to the special local conditions that invalidates all the statistics above. QED.
You will also notice that for some reason there was a sharp fall of traffic on Stambourne Way in 2013 (well at least on the 12 hours of the single day on which the count occurred). This also proves all local statistics from 2013 are artificially low! QED.
Now there are always going to be naysayers who point out that this is an exemplary example of exception fallacy which occurs when data about an individual is used to draw conclusions about a group. So we thought it only fair to look at more local roads in Croydon.
Amongst our large number of supporters we have people with a wide range of skills, so we asked ‘our’ statistician to explain:
“Warning: long stats message re traffic data 😅. Getting a bit clearer on what’s going on with the dft data. They collect data on a fixed sample of roads so they can look at change over time. But this is a small sample and not necessarily representative of what’s going on with traffic on all minor roads (ie in Croydon / London). This means there might be a mismatch or error between counts in sample and what would be if they actually counted all minor roads and not just a sample. Importantly, this “accumulates” over time.
So, every 10 years they do a benchmarking exercise which they collect data on a new and different larger sample (of minor roads). They look at the difference between the fixed and benchmark sample and come up with a correction factor and then apply that to the fixed sample, rolling it back over the previous decade. That’s why the traffic estimates were corrected up. Obviously the benchmark sample was higher, which is what’s going on in the graphs I plotted the other day, the average is much higher for the last 2 years. (PS this is in addition to the point about moving from individual roads to the aggregate, which still holds).
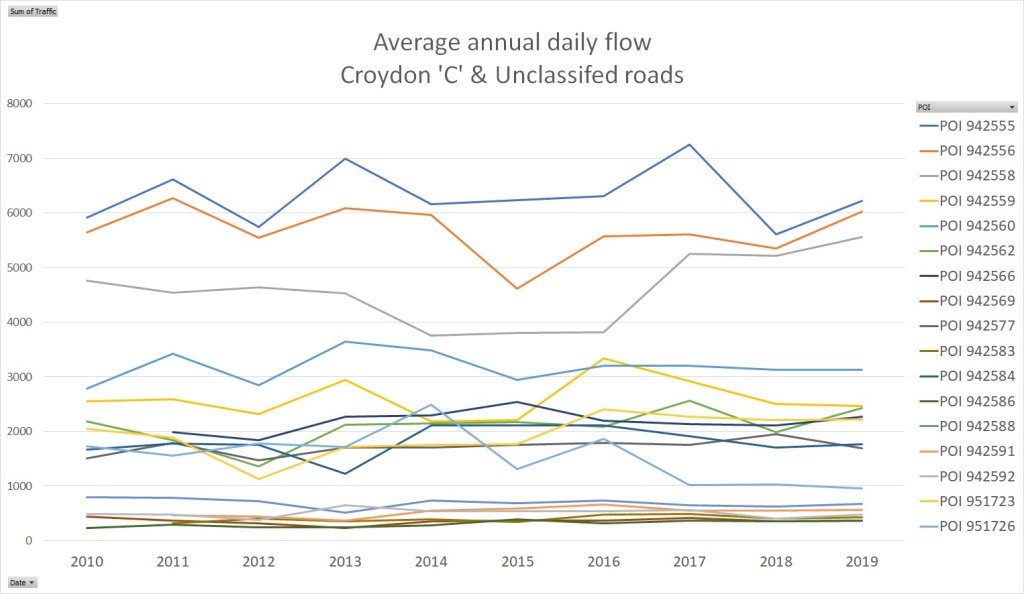
So in this chart. All the individual points are from the benchmarking exercise in 2018 and 2019 and the lines are from the fixed sample of roads which they measure every year.”
For the less technically minded we got a quote from (admittedly the more existential tendency) of the Open Our Minds activists network who said that “this explains why there is so much congestion in the area as all the roads appear to be criss-crossing”.
Open Our Roads managed to derive an average of the 17 routes above to produce what they claim is an Average Traffic on ‘C’ and Unclassified Roads in Croydon. They went on to claim: “In fact, official DfT statistics for one of the roads [Stambourne Way] in the LTN show no increase over the last decade. This is a trend mirrored across all C and unclassified roads in the Borough of Croydon that were monitored by DfT over the last decade and thus there is no evidence of any traffic increase within the LTN during this time.”
We decided to ask the DfT what they thought about inferring traffic levels in an area from limited road counts and they replied:
“The DfT traffic estimation process for minor roads is carried out at a regional level, and the traffic count sample is selected for producing regional and national level estimates. The traffic count data for a given location can be used to understand the trends for that specific minor road. However individual counts at minor road locations cannot be combined to produce a Local authority level. Traffic estimates for a local authority would need a larger sample size, and can’t be inferred from a limited number of raw minor road counts in that area. Please also note that traffic estimates are created from multiple sources, therefore changes in traffic in an area cannot be explained by changes in raw counts alone.”
The final piece of evidence is most shocking:

By an amazing coincidence this graph looks uncannily like the route of Stambourne Way, except the road is narrower and there are cars parked on corners making it an unlikely candidate to be a primary route for rat-run traffic.
