Given the quantity of data measured by DfT and other authorities, you would expect to find any number of studies into rat-run traffic. But no. Traffic statistics galore; traffic evaporation, yes. Even our favourite Rachel Aldred, Professor in Transport at the University of Westminster specialising in active mobility, appears to have only published a think-piece.
But the provision of more data from the Speedvisor device on Auckland Road gives us the opportunity to delve into this pernicious phenomenon.
Rat-run or rat-runners
This article makes no moral judgement on people who use rat-runs. It is focused on what causes rat-runs, the effect it has on local communities and what can be done about it.
What is a rat-run road?
A rat-run is a minor road that acts as a short-cut – in time or distance –compared to travelling on main roads. Before the advent of real-time traffic navigation, local people would have used these roads to bypass known congestion spots. But for residents, this would have been a minor blight compared with today’s mass diversion of traffic from congested main roads onto residential roads routed by real-time navigation systems – Waze, Google, TomTom.
Rat-runs at the macro level
There has been a significant rise in Croydon traffic volumes between 2010 and 2019 – an extra 200 million miles!

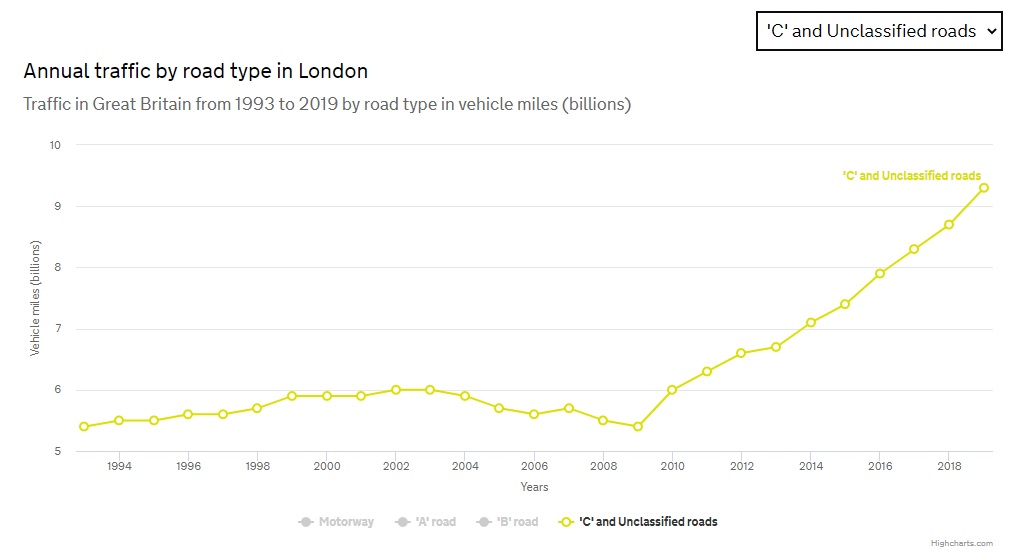
Virtually all the increase in traffic volume in London has taken place on ‘C’ and unclassified roads. Traffic on these roads almost doubled between 2009 and 2019.
This is roughly when navigation apps became very widely used. It reflects not just the uptake in using navigation apps, but also the development of these apps to measure congestion in real-time, compare routes, then divert traffic onto less busy residential streets.
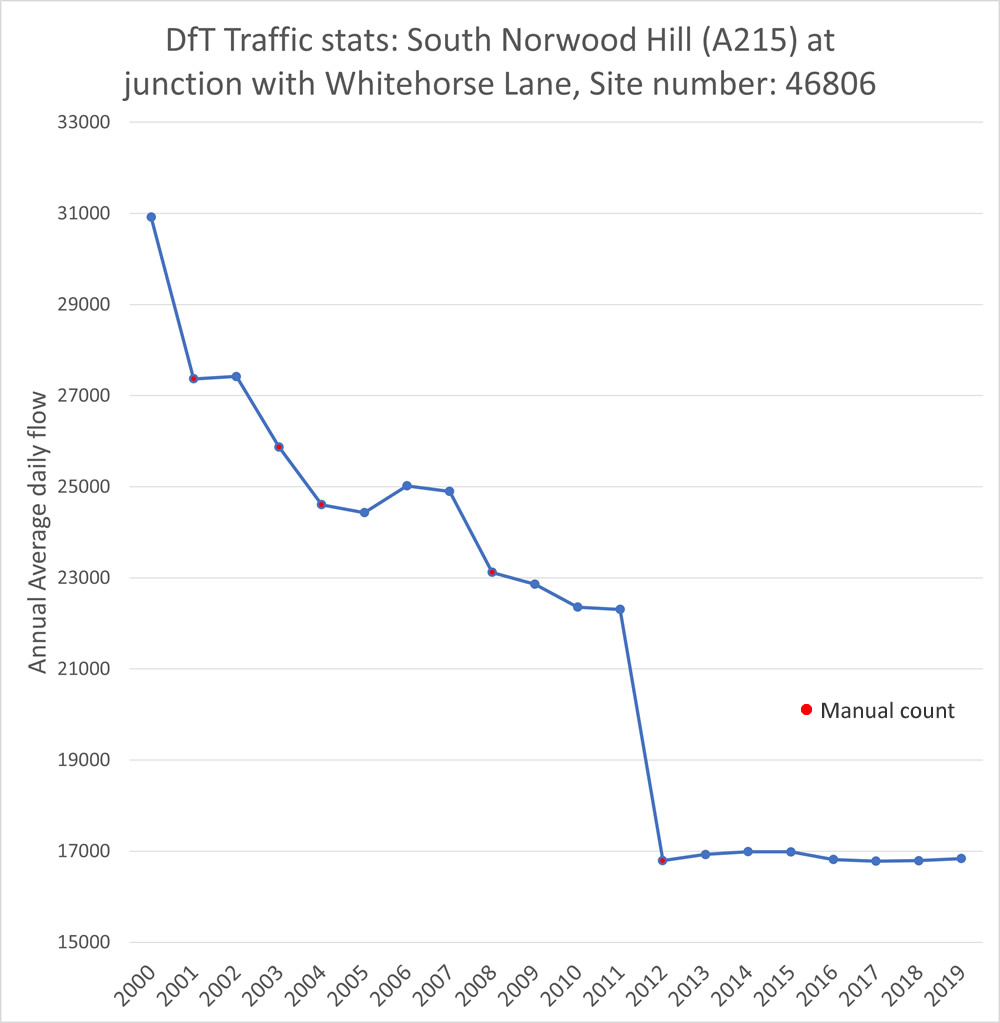
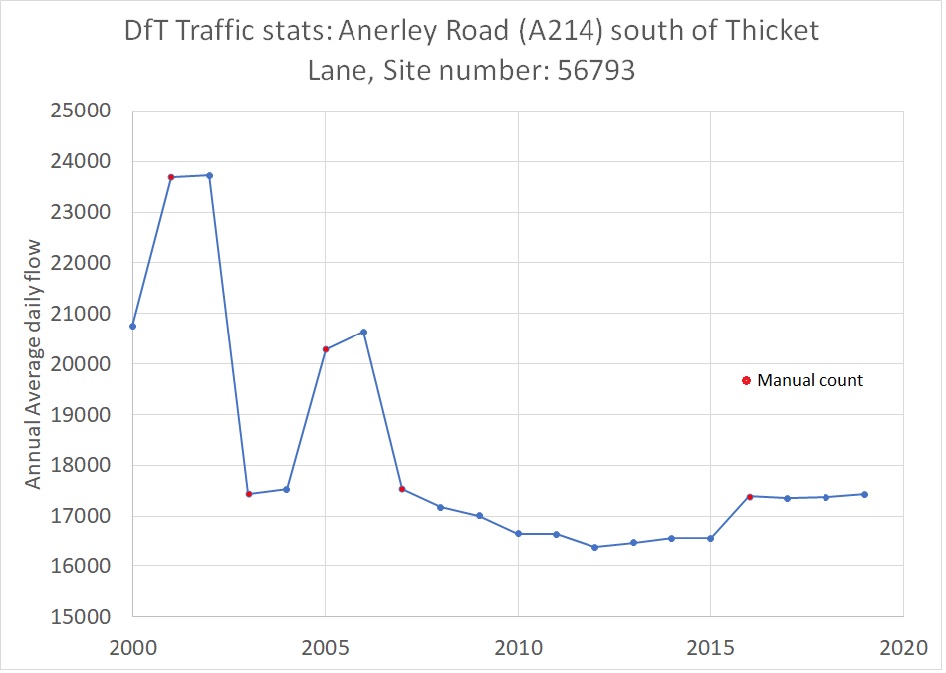
Meanwhile traffic on all the main roads that border the LTN has seen a significant decrease in traffic volumes:

Rat-runs locally
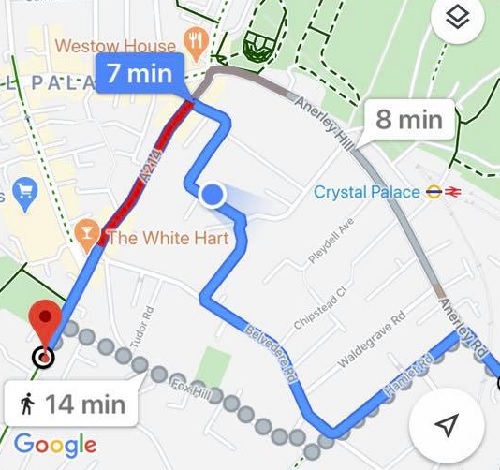
In August 2020 Shape Better Streets supporters conducted a survey into traffic being diverted onto a most ridiculous route – through narrow single carriage roads, up winding and hilly roads. All this to save one minute in theory, but by the time several vehicles had been diverted up this route, it would have undoubtedly resulted in longer journeys for most drivers. Observers noted that traffic came in pulses, most likely because of real-time feedback to data centres about new congestion hotspots created by the navigation systems themselves. Residents were quite rightly angered by the extreme levels of noise and pollution and because they couldn’t drive out of their own street in the opposite direction to the prevailing traffic. It is worth noting that in this case many residents were persuaded (by backwoods local Tories in opposition to their own Tory government policy and by I-must-drive-my-car-no-matter-what-the-consequences die-hards) to advocate for pushing this traffic into neighbouring roads rather than tackling it at source.
How does rat-run traffic manifest itself?
Perhaps the reason that there are so few studies into rat-run traffic is that data at a high level of granularity is required. Average or daily traffic counts are of no use because the very nature of a rat-run is that it creates traffic spikes.
After many years of campaigning by residents about excessive speed on local roads, it took a serious accident before the council installed a device (Speedvisor) which records the speed of every vehicle passing by (in one direction only). There is no evidence as to whether it has helped to reduce speeding, but at least we know that most drivers are speeding and that the record so far is 70mph in a 20mph speed limit. Until recently no-one had thought to analyse the data for volume of traffic, but recent Freedom of Information requests have produced a mass of raw data (see our Traffic page for full list and links to data).
So, it is ironic that a speed recorder that has done little to reduce speeding has given us some insight into fluctuating traffic volumes. It is not perfect because the data is aggregated by the hour, but at least it reveals much more than averages that some prefer to quote.
Rat-run traffic and spikes
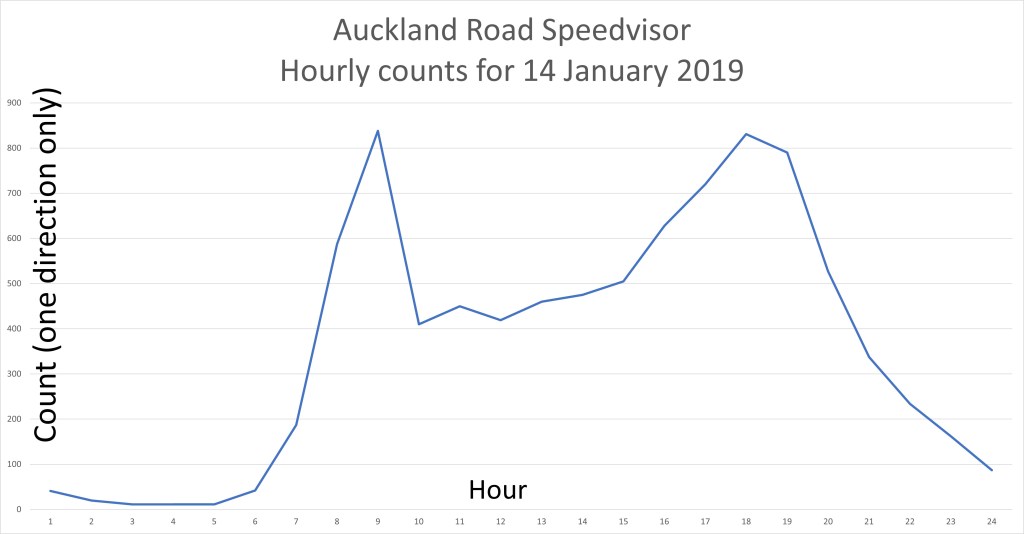
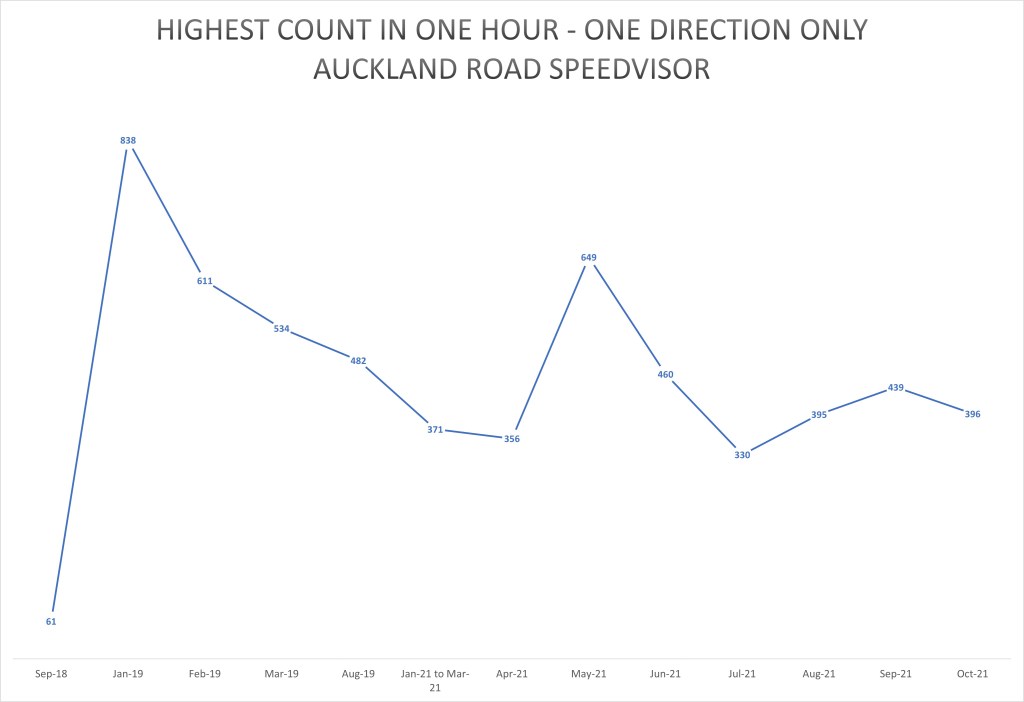
The most significant revelations are about how much the busiest hours vary over the day and how the volume has changed over the last few years.
| Hour | Total Counts | Max Speed mph | % Speeders |
|---|---|---|---|
| 1 | 41 | 45 | 81% |
| 2 | 20 | 60 | 75% |
| 3 | 11 | 40 | 64% |
| 4 | 11 | 40 | 100% |
| 5 | 11 | 45 | 64% |
| 6 | 42 | 45 | 93% |
| 7 | 187 | 50 | 87% |
| 8 | 587 | 50 | 73% |
| 9 | 838 | 45 | 64% |
| 10 | 410 | 50 | 75% |
| 11 | 450 | 45 | 76% |
| 12 | 419 | 50 | 79% |
| 13 | 460 | 50 | 78% |
| 14 | 475 | 55 | 82% |
| 15 | 505 | 50 | 84% |
| 16 | 628 | 45 | 77% |
| 17 | 720 | 45 | 75% |
| 18 | 831 | 50 | 67% |
| 19 | 790 | 45 | 68% |
| 20 | 527 | 45 | 79% |
| 21 | 337 | 50 | 83% |
| 22 | 234 | 55 | 89% |
| 23 | 162 | 60 | 87% |
| 24 | 87 | 55 | 91% |
| Month | Highest count in one hour | Interval (secs) one direction | ≈ interval both directions |
|---|---|---|---|
| Sep-18 | 61 | 59 | 30 |
| Jan-19 | 838 | 4 | 2 |
| Feb-19 | 611 | 6 | 3 |
| Mar-19 | 534 | 7 | 3 |
| Aug-19 | 482 | 7 | 4 |
| Jan-21 to Mar-21 | 371 | 10 | 5 |
| Apr-21 | 356 | 10 | 5 |
| May-21 | 649 | 6 | 3 |
| Jun-21 | 460 | 8 | 4 |
| Jul-21 | 330 | 11 | 5 |
| Aug-21 | 395 | 9 | 5 |
| Sep-21 | 439 | 8 | 4 |
| Oct-21 | 396 | 9 | 5 |
Conclusions
Pedestrians
Using the Manual for Streets, Rachel Aldred has calculated that traffic of around 100 in peak hours is the level below which pedestrians will share space with motor vehicles. In January 2019, Auckland Road experienced probably around 16 times this amount. It is not as though this level of traffic reduces top speed – at peak commuting times it still hits 45 or 50mph. It is little wonder that local disabled people have become distressed at attempting to cross the road when there are cars approaching at these speeds at intervals of every 2 seconds.
Cyclists
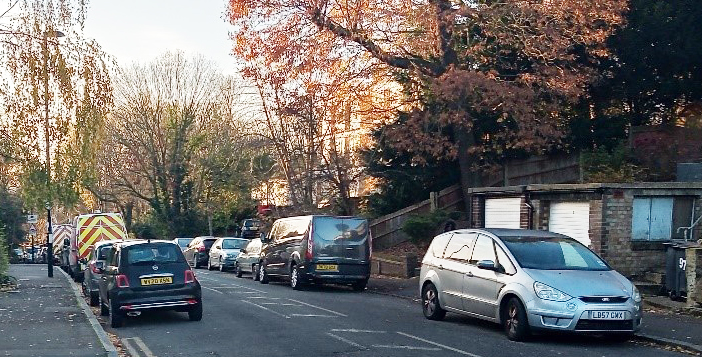
Many local experienced cyclists who regularly commute into central London report that Auckland Road (amusingly known as Cycle Route 29) is the most frightening segment of their journey. It would take extraordinary levels of sang-froid to face 2 to 3 tons of metal approaching you at these speeds when the road has been reduced to a single lane with vehicles parked on both sides of the road. Certainly not the conditions to take a child cycling.
What is the solution?
Clearly the only solution is to stop vehicles being able to pass from one main road to another. Filter points need to be located to ensure traffic coming from a main road has to exit to that same main road. Effectively we are talking about a Low Traffic Neighbourhood. In addition we have to protect any neighbouring areas so that traffic being pushed back does not infiltrate softer targets.
The Royal Automobile Club (RAC) is an unexpected source of advice:
What can be done to prevent rat running?
Rat running can be prevented by closing roads to through traffic using bollards and pavement build-outs or changing them to one-way streets.Some measures can deter rather than prevent rat running. They include:
– Speed bumps, speed cushions and speed tables
RAC December 2019
– Chicanes
– New lane markings
– Road narrowing
Notes on calculations
The very nature of rat-run traffic driven by modern navigation systems is that whenever there is congestion on main roads spikes of abnormal traffic are diverted onto minor roads. This means that even hourly aggregation will hide the most extreme spikes, so it is reasonable to use the figures above, knowing that in reality traffic would have been higher during the chosen hour.
It is also reasonable to assume that traffic is double that recorded by the Speedvisor. The fact there is little difference between morning and evening rush hours suggests that there is unlikely to be a significant differential by direction of travel.
838 vehicles in an hour equates to a vehicle every 4.3 seconds in one direction. Approximately a vehicle every 2 seconds in both directions.

Note: Zipcar which takes 13 personally-owned cars off the road reducing parking
Woman walking with heavy rucksack and man with pushchair (not recommended with our hills!)
Rat-run studies
Actual situation analyses of rat-run traffic on community streets based on car probe data. Yuki Sakuragi; Kojiro Matsuo (Toyohashi University of Technology); Nao Sugiki (Toyohashi University of Technology) October 2017
Car driver route choice: a perception study of the ‘rat running’ phenomenon at St Albans, Hertfordshire. JR Duffell & PJ Carden November 1983
Roads scheme reduces rat run traffic in West Hill by 22 per cent. Wandsworth Council September 2019
Measuring impacts of “rat-running” driver behaviour in urban environment using GPS-based traffic data Eloísa Macedoa, Ricardo Tomása, João Primoa, Margarida C. Coelhoa (Centre for Mechanical Technology and Automation, University of Aveiro, Campus Universitario de Santiago, Portugal)
Find out whose streets are worst for speeding and rat-running Basil Clarke Palmers Green Community March 2019
We’ve slowed down traffic in residential streets – now let’s reduce it Rachel Aldred February 2016
What is rat running and should cut-through traffic be illegal? RAC December 2019

Interesting analysis, but although I use different roads, I don’t think I regularly see traffic managing speeds of 45 or 50mph on my 9 mile commute.
I manage 20mph on my single speed cycle and very few cars pass me, those that do I catch and pass at the lights.
I must see if I can re route my commute up Auckland Road. I relish the challenge!
LikeLike
Auckland Road can be very intimidating for cyclists when cars are parked on both sides and you are on the single lane facing an SUV who is determined to come through. As an experienced commuter I thought I knew everything about keeping myself safe, knew all the tricks: awareness, positioning, speed, making myself appear big etc. But faced with the situation above, the only thing you can do is give way.
I didn’t mention this in the article as I wanted it to be factual, but in my view there is a psychology to rat-run drivers which might explain the ruthless driving and quite remarkable speeds. If you are going to take a minor road, which in all probability will have multiple road humps and a string of cars coming in the other direction, it is going to be a stressful situation. So if you don’t save that 1 minute 30 seconds promised by TomTom, what would be the point? Wouldn’t it be better to switch off the engine and listen to music while waiting for the lights to change at the bottom of South Norwood Hill? But no, we’ve taken the rat-run and need to drive aggressively, hoot at oncoming traffic and speed to make sure we do save that 1 minute and 30 seconds.
LikeLiked by 1 person
I think you are right, the route I take is minor roads, but a recognised route, and therefore I don’t encounter these rat runners. I only occasionally have “issues” with motorists, and I generally leave them standing. On one occasion a white merc caught up with me in Southern Avenue after I’d ticked him off in Whitehorse Lane, I was terrified and should have laughed and submitted to his alpha male status, but I squared up to him. ..
Fortunately he thought better of taking me apart, but I remember that, and need to control my confrontational instinct.
I think the speeds you have above 50 are out and out law breakers, possibly challenging the presence of the camera, it would be interesting to compare the figures with these taken out.
LikeLike