Executive Summary
In Summer 2020, LB Croydon introduced Streetspace LTN measures in response to the COVID-19 pandemic as part of the national (DfT) and regional (TfL) Streetspace programme.
The measures appear to have reduced personal injury collisions in the LTN area and at its junctions with the main road network by around 70%, against an increase in overall collisions at borough level.
The injury collision rate on boundary main roads was not observed to have increased, and overall the observed injury collision rate across the area (the LTN plus its boundary main roads) is 20% lower than expected.
It is likely that around six or seven injury collisions were prevented over the six month period during which the measures were in effect, and that a similar effect would be observed pro rata in a longer trial.
A strong positive effect on reducing collision rates was observed both within the LTN itself, and at the boundary junctions where minor roads meet the main road network.
However, the short time period that the measures were in place for (just 6 months), and the inability of this study to measure risk exposure (in terms of injuries per person/km walked or cycled), means that these figures are subject to some degree of uncertainty.
A longer trial period backed by detailed traffic counts for both active travel modes (to measure risk exposure) and motor vehicles (to assess traffic volumes and road user behaviour) would provide a more statistically robust result – an 18 month trial would be expected to prevent around 20 injuries across the area road network if the observed trend is shown to be correct.
Given the overall profile of injury collisions on local roads, Streetspace LTN measures cannot be considered a panacea, and further Streetspace trials should be supported by complementary measures to improve safety on main roads – in particular, improved pedestrian facilities at main road junctions.
Source Data
Road danger reduction dashboard and data –Transport for London
Streetspace collision data analysis – Introduction
In late Spring & early Summer 2020, LB Croydon introduced a series of Streetspace measures aimed at encouraging people to use active travel (walking, cycling and scooting) for a greater proportion of their journeys. The benefits of active travel have been written about at length, and this article does not seek to cover old ground.
Since these measures were temporarily reduced, there has been much debate as to their effect on road safety. The DfT & Police collect data on reported road traffic collisions, and have just released the 2020 data. This article will attempt to use this data to determine whether the introduction of these measures may have resulted in changes in the crash rate – for better or for worse.
An inexact science
Given the relatively small area covered, and the short time period for which these measures were in, reaching robust conclusions may present a challenge. There are other valid ways to analyse the available data – I will disclose all methods used here, and I welcome attempts to re-run this or similar approaches using different constraints.
In particular – not all collisions are reported (it has been estimated that, city-wide, there are three unreported minor injury or non-injury incidents for each reported STATS19 incident), and it is beyond the scope of this article to verify each incident beyond the level of detail provided by the DfT STATS19 data set. Collision locations are as reported on CrashMap, and no attempt is made to ascribe blame to a particular road layout or type of road user. STATS19 records personal injury collisions: it does not record collisions in which vehicles were damaged but nobody was hurt; in many cases, minor injuries to pedestrians and cyclists (typically those not requiring ambulance attendance) also go unreported.
The majority of collisions occur at or near junctions – in many cases there is a direct causal link (in that junctions are where conflict occurs: vehicles turning in and pulling out; pedestrians crossing) – but the junction may not have been the cause in every single case. The classifications used here – in particular relating to how the different locations on the main road network (uncontrolled junctions with “through” and “access-only” minor roads especially) are not watertight: a road which is access-only in nature (for example the NSC access road) may carry a non-trivial amount of traffic despite having no “through” function, and some main road crossroads junctions have both a “through” arm and an “access only” one.
STATS19 classifies incidents by severity (“Minor”, “Serious” – those requiring an overnight hospital stay for one or more party – and “Fatal”) and the type of road user involved. This analysis does not differentiate between different types of road user or incident severity or attempt to ascribe weightings by incident severity, rather it looks at the overall picture & treats all reported incidents as equivalent.
An imperfect measure
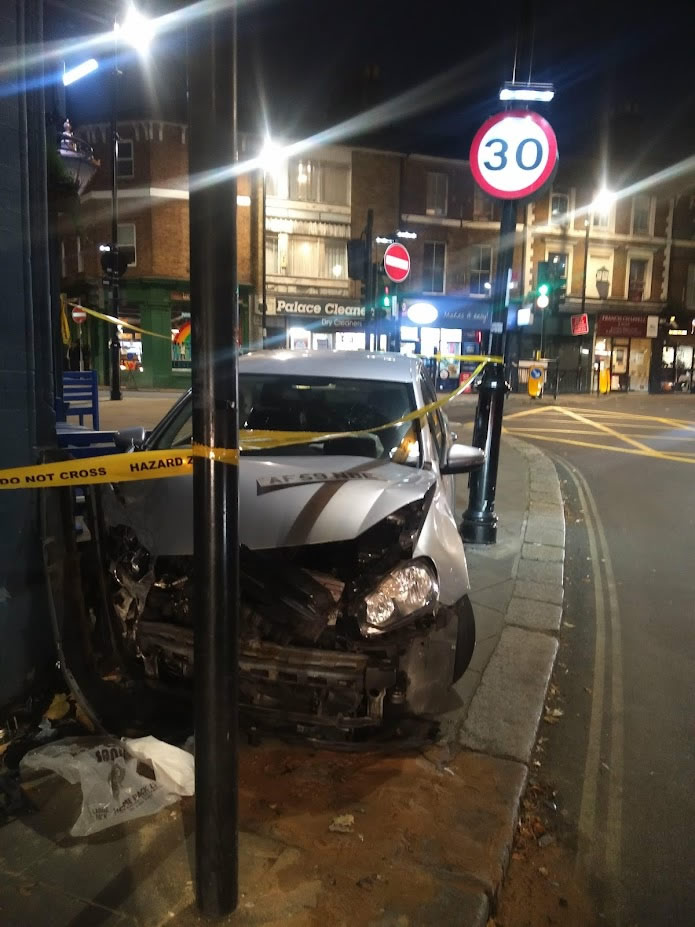
Measuring collisions alone is not an adequate measure of road danger, in terms of its chilling effect on active travel specifically – or indeed the wider harms caused: parked cars damaged (with the associated hassle and expense), street furniture wrecked (which our benighted Council can ill-afford to repair), beloved family pets run down and killed without anybody but their devastated owners seemingly batting an eyelid.
To give an extreme example – you can legally cycle on the A3 Kingston Bypass, and very few cyclists are injured there – this does not, in any way, mean it’s a safe road to cycle on. A more reasonable measure of danger is risk-exposure: that is, for every 1000km walked, how many people are hurt, after adjusting for the relative vulnerability of different groups. Without knowing how the Streetspace measures changed behaviour (increasing the amount of walking or cycling, say), it’s not possible to say whether there was more or less exposure to danger in the time period studied.
A spirit of inquiry
This article and its conclusions represent a single pass through the data – as I write it, I don’t know what will be found. Being clear about the methods, and the limitations of those methods and the available data, will allow others to reproduce these results or to try their own experiments.
Time period: This analysis considers year-on-year data for the five years leading up to 2020 (during which time Streetspace measures were not in effect) as its control group, and the six months from July to December 2020 as the experiment. It specifically does not look at the first half of 2020: Auckland Road was shut for gas works during January and February; in late March, April and May there was hard lockdown with very little traffic; Streetspace measures were introduced piecemeal during late Spring and early Summer. July through December 2020 represents a period of relative normality: although many people in non-manual occupations were still working from home, schools reopened as normal in September & overall traffic levels for the period were close to normal.
Data set: The DfT STATS19 database is used, via the Crashmap GIS web service. I have classified the locations of incidents (collisions resulting in personal injury, as reported to STATS19) as follows:
- Within LTN – an incident taking place within the LTN area.
- LTN / Main Road boundary junction – an incident taking place at the boundary between the LTN area and the main road network (where traffic turns from main roads on to low traffic streets, or vice versa).
- Main Road network – an incident on the main road network, further categorised as:
- Main road only – taking place on a straight segment of main road.
- Main road, signal controlled junction – a traffic light controlled junction, with or without pedestrian facilities (some of Croydon’s are badly lacking).
- Main road – uncontrolled junction with Access Only road – a junction between a main road and an access road or dead-end (for example Grange Avenue or Fitzroy Gardens).
- Main Road – uncontrolled junction with Through minor road – a junction between a main road and a minor road which carries some “through” traffic (for example South Norwood Hill / Ross Road, or Church Road / Upper Beulah Hill).
I have applied this classification as, subjectively, the boundary junctions have always felt like a particular danger area which became much safer when the Streetspace measures went in. The main road sub-categories are so as to indicate where the worst problems are occurring – and may imply different types of remedial action which might prove effective.
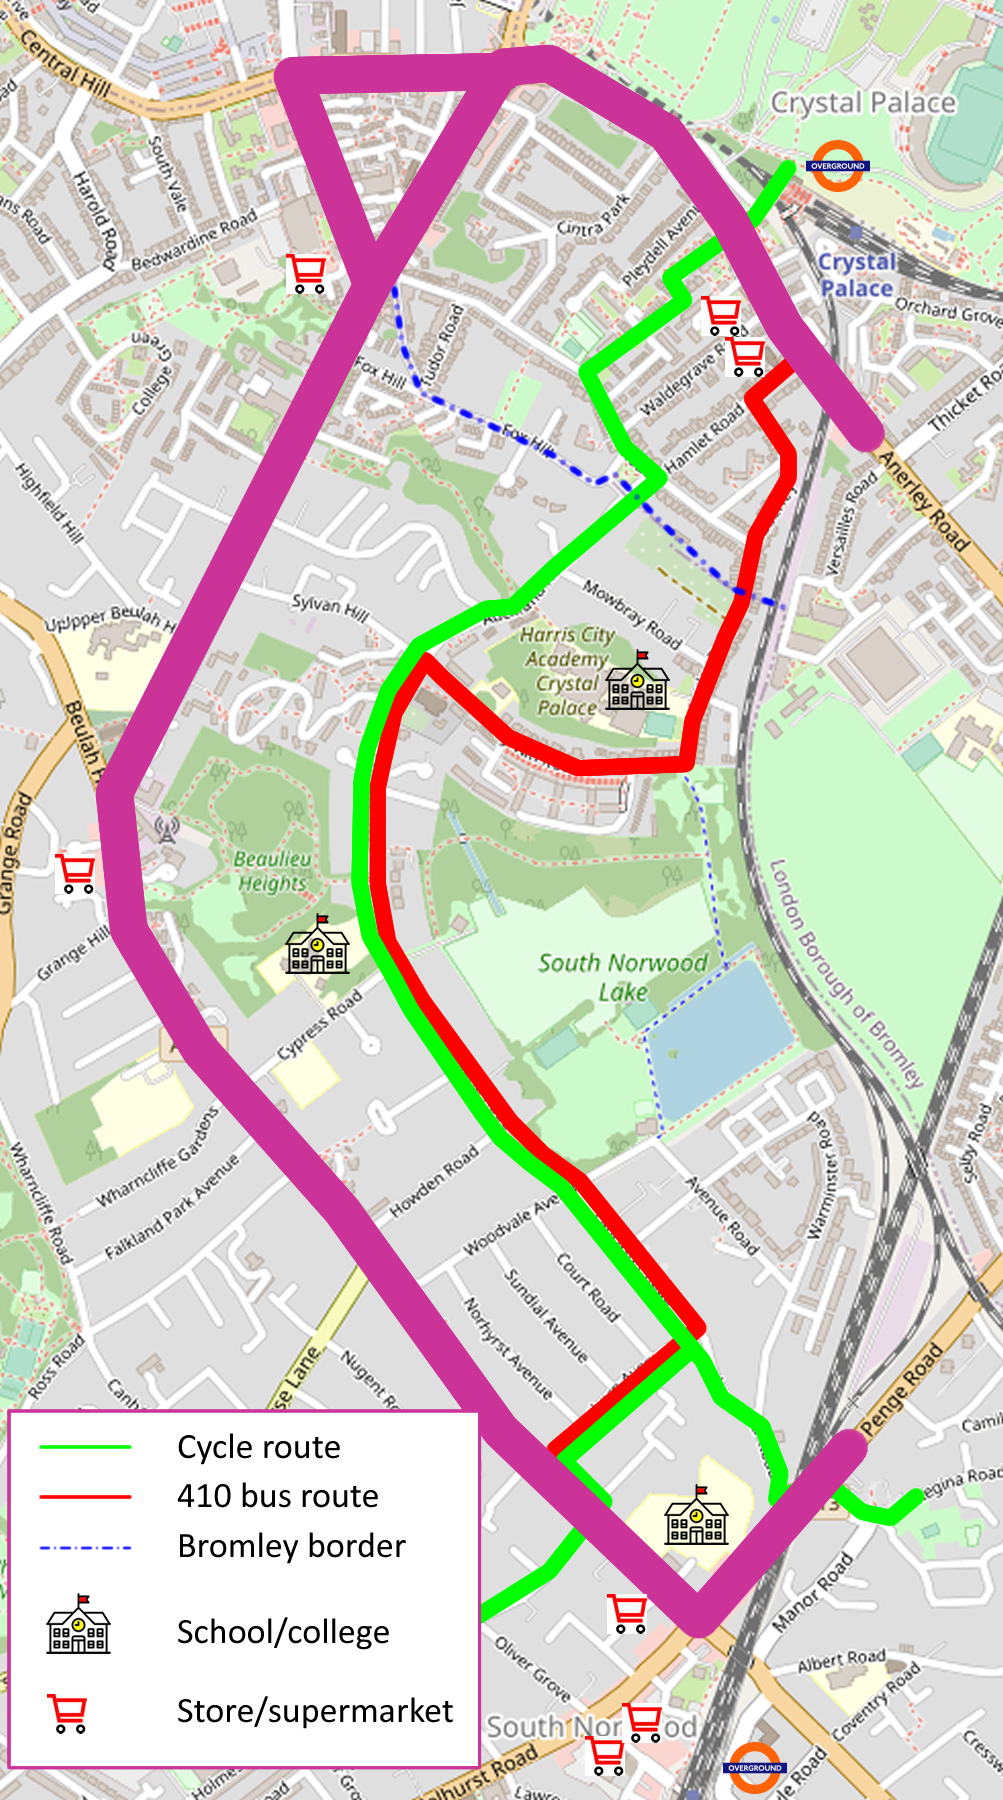
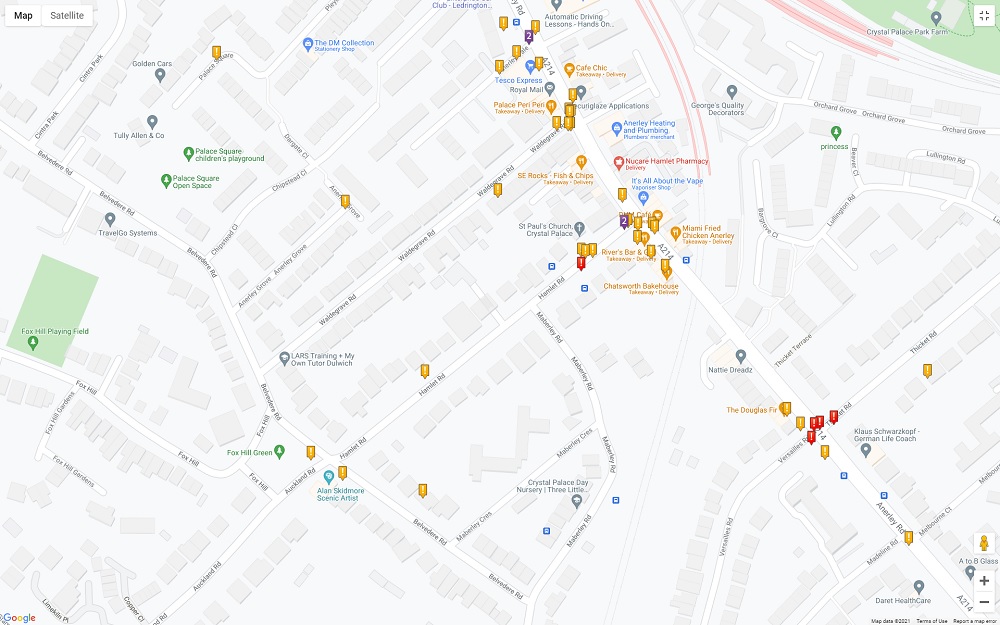
Spatial considerations: This analysis considers the boundary of the LTN area to be the Croydon and Crystal Palace railways in the east, South Norwood High Street and South Norwood Hill to the south and west, Church Road to the north west, Anerley Hill to the north east, and the three main roads making up the Crystal Palace Triangle (Church Road, Westow Street, Westow Hill).
It does not look at A213 Croydon Road north of Goat House Bridge, or Anerley Hill south-east of Hamlet Road, nor does it attempt to quantify the impact on other residential roads near the LTN boundary (such as Harold Road or Wharncliffe Road) which may at times have seen increased usage by motor vehicles attempting to divert around queues or find new cut-through routes. Nor is it able to consider the impact of temporary road works on South Norwood Hill or the disruption at the Church Road / Westow Street junction during summer 2020 caused by a damaged building.
For the purposes of this study, the Bromley roads at the northern end of the LTN are considered to be within the LTN boundary. This may not reflect the lived experience of some residents, as a certain amount of traffic was observed to divert via Milestone Road and Cintra Park specifically. Any relevant qualitative observations in the 2020 data will be noted. The motivation for this is the need to study Anerley Hill as a boundary road, and to consider the Waldegrave Road and in particular Hamlet Road boundary junctions (the latter being a notable collision hotspot) as likely to have benefited from reduced flows.
Holmesdale Road, while not part of the Crystal Palace LTN, was subject to similar modal filtering measures under the same programme and at a similar time, therefore the boundary junction between South Norwood Hill and Holmesdale Road is considered an LTN boundary junction for this analysis. Holmesdale Road itself is not analysed, nor are its parallel main roads Whitehorse Lane or South Norwood High Street (south of the Portland Road crossroads).
Junctions are recorded using the names of two of the roads meeting at that location. This does not necessarily imply that the incident took place on one of the two arms named, when a junction has more than two arms with individual names.
Certain roads within the Healthy Streets / LTN boundary already enjoy the benefit of modal filtering (for example Palace Square, Tudor Road, Lansdowne Place) – unfortunately this does not make them entirely immune from incidents, and any such incidents are recorded as taking place within the boundary, even in cases (Palace Road, Palace Square) where they have no direct road connection with the rest of the LTN interior.
The status quo
The STATS19 incident rate for the area under consideration for the five years to 2020 can be summarised as follows.
In the five year period covering the years 2015-2019, 256 personal injury collisions were reported, an average of 51 people per year, 1 person per week.
The overall trend is approximately static, but there is some indication of an upward trend on personal injury collisions within the LTN area and at the boundary junctions of that area, corresponding with the increasing use of sat nav. This is a topic which would benefit from further analysis covering a longer time period – if this trend is shown to be real, it would be particularly disappointing given Croydon’s introduction of 20mph speed limits on minor roads in 2016-7, indicating that the increase in traffic flows on such roads has more than offset any safety gains from the 20mph limit (said gains may be rather modest, given overall poor compliance with the 20 limit indicated by speed survey data).
The breakdown of collision locations 2015-2019 is as follows:
| LTN area | 42 | 16.5% |
| LTN boundary junctions, uncontrolled | 57 | 22.2% |
| Main road | 47 | 18.4% |
| Main roads – signalled junction | 48 | 18.8% |
| Main road – uncontrolled, “access” | 37 | 14.4% |
| Main road – uncontrolled, “through” | 25 | 9.7% |

Fig. 1: All collisions, by year and by type

Fig. 2: All collisions, by type
Just the cost of doing business?
Every single week, this small, local network of roads injures a human being – and seriously enough that the police have to be involved. In any other public space or working environment, this would be regarded as intolerable. It is notable that the Health & Safety culture developed in the working world over the last three to four decades is for some reason not seen as applicable to the roads: any business which were to cause injury to its customers or staff every week, week in week out, in ways that are predictable and preventable, would face severe financial penalties or even prosecution.
And so anybody who purports to care about the wellbeing of the community should regard this as a matter in need of urgent intervention, radical change, and significant investment to address the problem. This is not, however, the same as saying that “something” must be done for the sake of it – any measures adopted must be effective.
Solving the right problem?
The discussion surrounding Croydon’s Streetspace measures has been long-running and often ill-tempered. A point is regularly raised that there is supposedly “no danger problem” on the LTN roads, and therefore the council is solving a problem that doesn’t exist.
Quite aside from the fact – discussed above – that collisions alone cannot measure the suppressive effect of road danger on active travel – this is only partially true.
The LTN roads themselves – the “interior” of the area – contribute only 16.5% of all injury collision incidents out of the recorded total. However, a network of back streets used for traffic shortcuts inevitably produces a large quantity of uncontrolled junction movements on the main roads. Uncontrolled main road junctions are the most dangerous part of the road network – taking them all together (uncontrolled junctions from main roads to cut-through roads in the LTN area, uncontrolled junctions between main and access-only roads, and uncontrolled junctions between main roads and other cut-through roads outside the LTN area), these main/minor road junctions are the site of almost half the collisions in the entire network.
So when we look at those roads and junctions which ought to benefit from the LTN interventions – that is to say, the roads inside the LTN area, and the junctions between those roads and the main road network – this represents just under 40% (2015-19) and 51% (2019 data only) of the overall burden of injury which may be reduced by restricting use of these minor roads as cut-through “short cuts”. Whether or not there are signs that the experiment actually was effective will be discussed below.
Dirty data sets a high bar
It is regrettable that Croydon decided to end the Streetspace trial early, in January 2021. Because of the relatively limited amount of data available, and the quasi-random nature of road traffic collisions, the control group data is noisy. This means that, given the short time period for which the measures were in place, an extremely strong signal will need to be present (in terms of an increase or reduction in crash rate) for it to be detectable amongst the random background fluctuations.
A longer trial period of 18 months to 2 years would enable the collection of considerably more robust data, less vulnerable to the fluctuations of random chance.
To give an example: Looking at the LTN streets and their adjoining boundary junctions together, the mean average number of collisions we’d expect to see in a 6 month period is 9.9
But given the level of fluctuation (variance in statistical terms), a wide range of actual values could be expected.
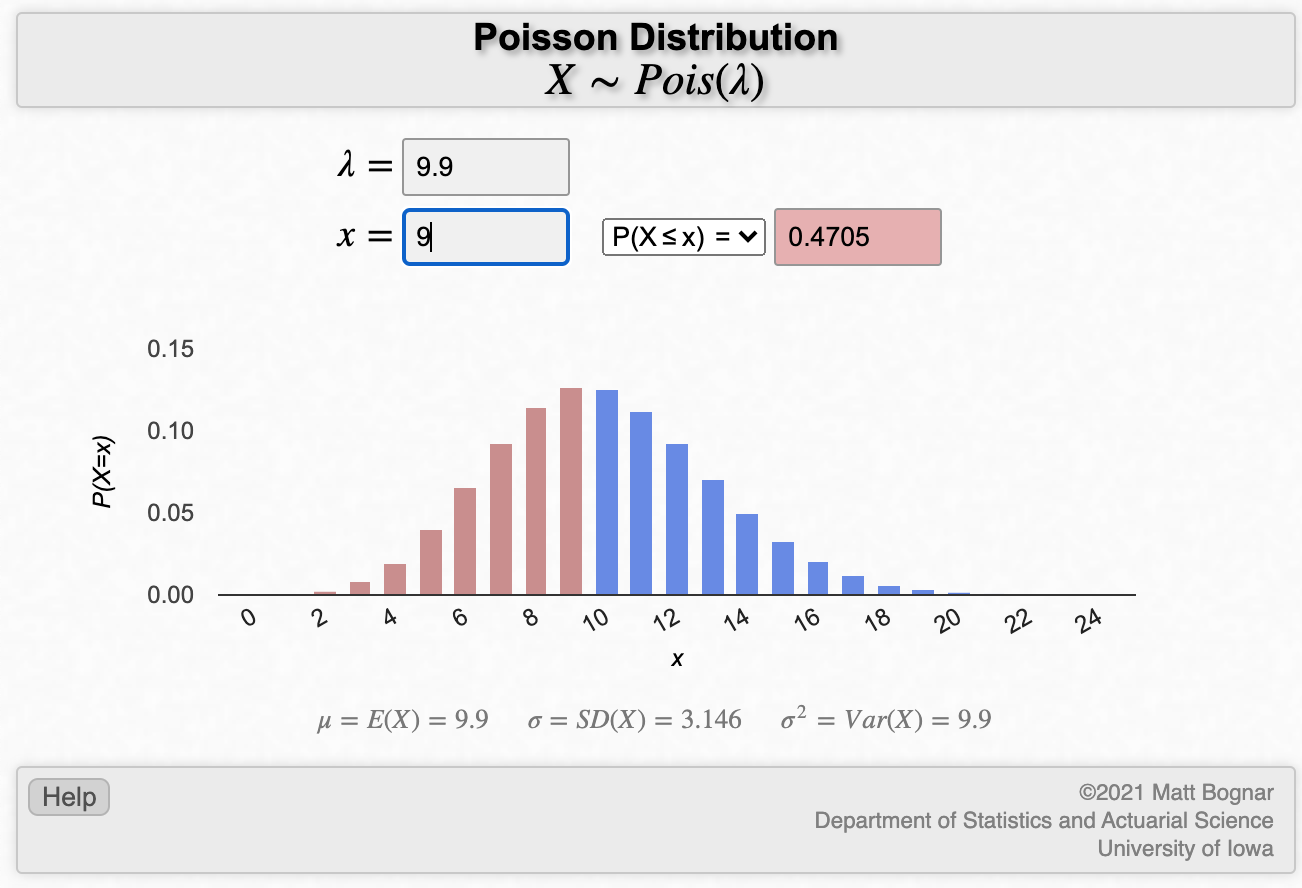
Fig. 3: Poisson distribution, λ = 9.9
In layman’s terms, it can be seen that a number of collisions between 6 and 14 inclusive would be considered commonplace, with a value of 5 or less having roughly a 7% likelihood of occurring by chance, 3 or less occuring ~1% by chance.
Statistical analysis is a complex topic, and if you’d like to know more, the British Medical Journal offers a readable high level explanation here (read Chapter 4 specifically):
Statistics at Square One (bmj.com)
Further information on the specific method used can be found here:
Numeracy, Maths and Statistics – Academic Skills Kit
And the calculator used can be found here:
Poisson Distribution Applet/Calculator
Streetspace 2020 – headline results
LTN Interior Only
The mean average collision rate for the LTN area 2015-2019 is 4.2 for a 6 month period.
The observed number of collisions during July-December 2020 was just 1.
This could represent an effective reduction in the collision rate of around 75% for residential roads in the LTN area. But there is a probability of 7.8% that this result was obtained by chance.
This points to a strong conclusion that the Streetspace measures improved safety on the roads within the LTN area, but a longer trial would produce a more conclusive result.
LTN & Boundary Junctions
The mean average collision rate for the LTN & boundary junctions together (all those which might benefit from the Streetspace interventions) is 9.9 for a 6 month period.
The observed number of collisions during July-December 2020 was just 3.
This could represent an effective reduction in the collision rate of around 70% for the LTN area and its boundary junctions. The probability of seeing these few collisions if the interventions had caused no change to network safety is just 1%.
This points to a very strong conclusion that the Streetspace measures improved safety on the LTN area together with its boundary junctions.
Overall road network
The mean average collision rate for the network as a whole is 25.6 for a 6 month period.
The observed number of collisions was just 21.
Whilst this does appear to be a reduction of around 20% in the overall accident rate, the likelihood of this result having occurred by chance is also around 20%. A six month trial period may not be sufficient to draw firm conclusions about overall network safety effect.
Displacement effect – are main roads more unsafe?
The mean average collision rate for the main road network – including its boundary junctions with the LTN roads – is 21.4 for a 6 month period.
The observed number of collisions was 20.
It can be concluded that the Streetspace interventions did not make the main road network more dangerous overall, but nor did they likely make it safer. More data is needed here from a longer trial, but additional measures aimed specifically at improving safety on the main road network should be considered.
If the specific objective of Streetspace is to create safe corridors from active travel – for which it appears to be effective – a modest amount of displacement effect may be considered acceptable. No such displacement is observed, but nor can it be said that the benefits of this intervention are shared equally.
2020 July – December: Normal or not?
Much has been written about travel patterns during the pandemic, with deep changes to working and commuting patterns, many people at times choosing to avoid public transport, and the widespread adoption of Streetspace measures all across London – particularly the inner boroughs.
It is therefore important to consider whether the count data recorded for H2 2020 is reflected in wider patterns across the city unrelated to Streetspace, or whether the collision rates recorded in this local area buck the trend.
Unfortunately there are limitations to the available datasets and tools, with a range of geographical and time-bracketing capabilities none of which are ideal for our purposes. However, using a range of sources should allow an overall picture to be painted & pick up any major trends.
The London-wide collision rate was down 10% compared to the five year average for a six month period (mean = 15527, observed = 13984, source: TfL Road Danger Reduction dashboard).
This may be driven in part by Streetspace measures (adopted much more widely in some boroughs than others), and/or by very much reduced activity in Zone 1.
Looking at neighbouring South London borough in aggregate – Bromley, Croydon and Sutton together – the collision rate was down 6.5% compared to the five year average (mean = 1284, observed = 1201). None of these boroughs can be considered to be enthusiastic adopters of Streetspace – with just a handful of pilot schemes in each; traffic levels in the Outer London boroughs were closer to, or in some cases exceeding, the previous five years.
Croydon borough alone saw its injury collision rate increase by 11.5% (mean = 555.5, observed = 619). More detailed spatial analysis should be carried out to determine potential causes. As outlined above, the collision rate on the LTN boundary main roads was stable (therefore below the borough-wide trend), and there is no obvious indication that this increase was focused on other residential areas nearby the LTN and therefore potentially caused by traffic displacement. Nonetheless this would benefit from further study, and comparing similar roads to which Streetspace measures were not applied would be a useful exercise.
Furthermore as outlined above (“An imperfect measure”), the collision rate alone cannot measure the key metric of risk exposure – that is, how likely is a vulnerable road user to be hurt per km walked or cycled. A higher rate of walking or cycling could lead to a higher overall collision rate, even if conditions had actually become safer.
Active travel traffic volume counts and qualitative survey data carried out by the Shape Better Streets residents’ campaign, as well as city- and country-wide data, point to a large increase in walking and cycling in H2 2020 – and therefore a corresponding increase in risk exposure, and expected collision rate. Resident counts suggested an increase in cycle movements in the LTN area of up to 3x, and a high proportion of respondents to a qualitative consultation stated that they or their family members had been walking / cycling more.
To achieve such a decrease in reported collisions in the Streetspace LTN area, with boundary-road conditions stable and a significantly larger volume of vulnerable road users on the road, suggests that these measures may in fact be even more effective in improving safety and reducing road danger for active travellers than the simple collision counting method would imply.
If not this, then what? If not now, then when?
There has been much debate as to the effectiveness of Streetspace measures in creating safe space for active travel, as well as the fairness of reserving certain street space (whether a proportion of a main road carriageway, or by revoking “through” motor access from a minor road) to prioritise active travel modes.
The results – in terms of the effectiveness of Streetspace measures in improving safety for active travel modes using these routes – speak loudly and clearly for themselves.
However, a longer trial period would considerably reduce uncertainty in the data – a 12 month trial would reduce uncertainty considerably, and 18 months should be sufficient to generate highly accurate results.
Given the effectiveness of these measures, parallel schemes should be considered in other similar areas – it is likely that the Streetspace measures prevented six or seven injury collisions in just the six month period they were in effect for. Applying these measures in additional areas could literally save lives.
But this type of relatively low-cost Streetspace scheme cannot be seen as a panacea for injury prevention. To meet the Mayor’s Vision Zero targets, further investment is needed to protect vulnerable road users at main road signal controlled junctions – many of which, in this local area, do not meet modern standards.
Those who seek to delay or obstruct Streetspace measures for reasons of their own convenience should consider: in what other part of modern society is convenience and profit placed before health and lives? What alternatives exist which could both cut injury rates and enable more people to enjoy the health, environmental, social and financial benefits of incorporating more active travel in to their lives?
Angus Hewlett for Shape Better Streets, October 2021
With thanks to John Hodsoll and Anna Goodman
Appendix: Method
The primary data source for this study was CrashMap , a web-based GIS visualisation of DfT STATS19 created by Agilysis.
Collision data locations were bracketed by calendar year (2015-2019 as control, six month period H2 2020 as experiment) and classified manually into the six categories used in the study (LTN, boundary junction, main road controlled junction, main road linear segment, and main road uncontrolled junctions with and without through traffic).
Five year mean collision rates were estimated for each category, and Poisson cumulative probability analysis used to compare this with the observed rate during the second half of 2020.
See also Resources/Safety on this website
